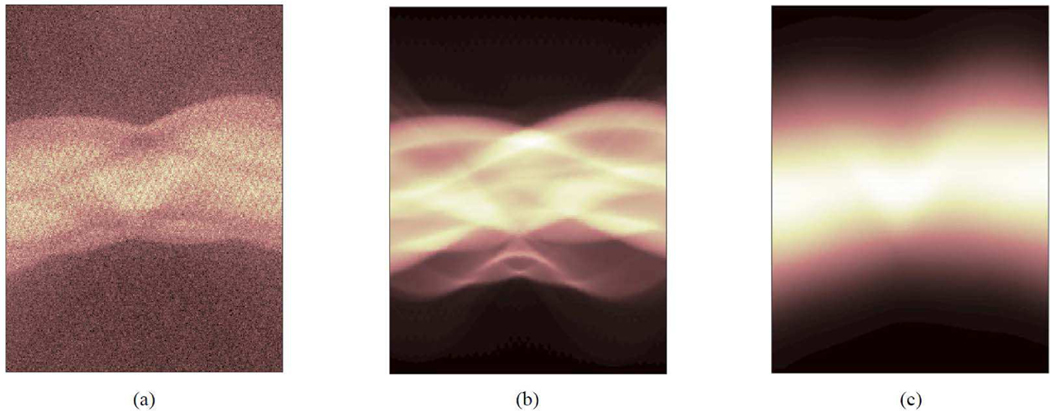
Fig. 4.
A set of 2D sinograms extracted from a 3D PET dataset of a patient scan, (a) The emission sinogram, (b) the log(ACF) sinogram, and (c) the estimated scatter sinogram based on the 3D SSS model. The vertical axis is the radial distance ranging from −35 cm to +35 cm and the horizontal axis is the projection angle ranging from 0 to 180 degree. The radiotracer is 18F-FDG.

