Figure 1.

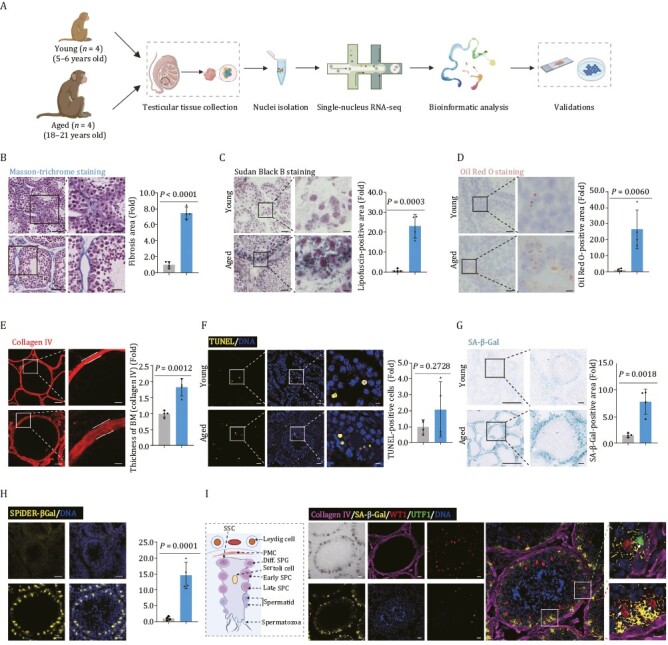
Aging-related phenotypes of the cynomolgus monkey testes. (A) Flow chart of experimental design of testicular aging study in cynomolgus monkeys. (B) Masson-trichrome staining analysis of testicular tissues from young and aged monkeys. Representative images are shown on the left. Quantitative data are shown as means ± SEM on the right. Fibrosis area is quantified as fold changes (Aged vs. Young). Young, n = 4; aged, n = 4 monkeys. Scale bars, 50 μm and 25 μm (zoomed-in image). (C) Sudan black B staining of testicular tissues from young and aged monkeys. Representative images are shown on the left. Quantitative data are shown as means ± SEM on the right. Lipofuscin-positive area is quantified as fold changes (Aged vs. Young). Young, n = 4; aged, n = 4 monkeys. Scale bars, 50 μm and 12.5 μm (zoomed-in image). (D) Oil Red O staining of testicular tissues from young and aged monkeys. Representative images are shown on the left. Quantitative data are shown as means ± SEM on the right. Oil Red O-positive area is quantified as fold changes (Aged vs. Young). Young, n = 4; aged, n = 4 monkeys. Scale bars, 50 μm and 12.5 μm (zoomed-in image). (E) Immunofluorescence analysis of type IV Collagen in basal membrane of seminiferous tubules. Representative images are shown on the left. Quantitative data are shown as means ± SEM on the right. Thickness of basement membrane (BM, marked by collagen IV) is quantified as fold changes (Aged vs. Young). Young, n = 4; aged, n = 4 monkeys. Scale bars, 20 μm and 5 μm (zoomed-in image). (F) TUNEL analysis of apoptotic cells in testicular tissues from young and aged monkeys. Representative images are shown on the left. TUNEL-positive cells are quantified as fold changes (Aged vs. Young) and shown on the right. Young, n = 4; aged, n = 4 monkeys. Scale bars, 20 μm and 5 μm (zoomed-in image). (G) SA-β-Gal staining of testicular tissues from young and aged monkeys. Representative images are shown on the left. SA-β-Gal-positive areas are quantified as fold changes (Aged vs. Young), and shown as means ± SEM on the right. Young, n = 4; aged, n = 4 monkeys. Scale bar, 300 μm and 50 μm (zoomed-in image). (H) SPiDER-βGal staining of testicular tissues from young and aged monkeys. Representative images are shown on the left. SPiDER-βGal-positive areas in the tissues are quantified as fold changes (Aged vs. Young), and shown as means ± SEM on the right. Young, n = 4; aged, n = 4 monkeys. Scale bar, 20 μm (zoomed-in image). (I) Co-stainings of SA-β-Gal, collagen IV, UTF1, and WT1 in testicular tissues from aged monkeys. A schematic of the germinal epithelium of seminiferous tubule is shown on the left. Representative images are shown on the right. Scale bars, 20 μm and 5 μm (zoomed-in image).
