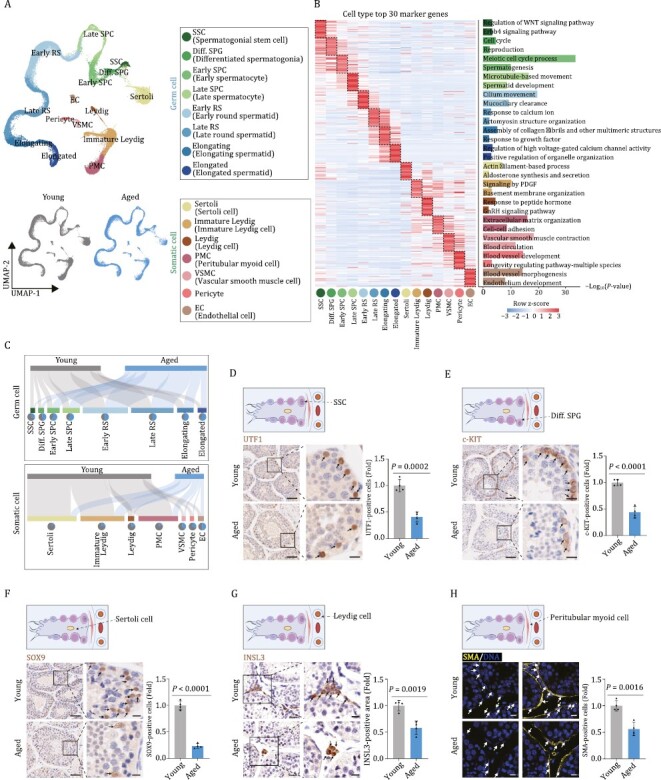
Figure 2.

Single-nucleus transcriptome profiling of young and aged cynomolgus monkey testes. (A) Uniform manifold approximation and projection (UMAP) plot showing the cell types of monkey testes. Top, UMAP plot showing the 15 cell types of monkey testes. Bottom, UMAP plots showing distribution of different cell types in the young (left) and aged (right) testes. (B) Heatmap showing the expression profiles of top 30 cell type-specific marker genes of different cell types in the monkey testes with their enriched functional annotations on the right. Left, each column represents one cell type and each row indicates the expression level of one marker gene. Right, enriched GO terms for each cell type. (C) Sankey plots showing the changes of proportion across different cell types between young and aged groups. Top, germ cell group; bottom, somatic cell group. (D) Immunohistochemistry analysis of UTF1 in testicular tissues from young and aged monkeys. Representative images are shown on the left. UTF1-positive cells are quantified as fold changes of their numbers (Aged vs. Young), and shown as means ± SEM on the right. Young, n = 4; aged, n = 4 monkeys. Scale bars, 50 μm and 12.5 μm (zoomed-in image). (E) Immunohistochemistry analysis of c-KIT in testicular tissues from young and aged monkeys. Representative images are shown on the left. c-KIT-positive cells are quantified as fold changes of their numbers (Aged vs. Young), and shown as means ± SEM on the right. Young, n = 4; aged, n = 4 monkeys. Scale bars, 50 μm and 12.5 μm (zoomed-in image). (F) Immunohistochemistry analysis of SOX9 in testicular tissues from young and aged monkeys. Representative images are shown on the left. SOX9-positive cells are quantified as fold changes of their numbers (Aged vs. Young),and shown as means ± SEM on the right. Young, n = 4; aged, n = 4 monkeys. Scale bars, 50 μm and 12.5 μm (zoomed-in image). (G) Immunohistochemistry analysis of INSL3 in testicular tissues from young and aged monkeys. Representative images are shown on the left. INSL3-positive areas are quantified as fold changes (Aged vs. Young), and shown as means ± SEM on the right. Young, n = 4; aged, n = 4 monkeys. Scale bars, 25 μm and 12.5 μm (zoomed-in image). (H) Immunofluorescence analysis of SMA expression in testicular tissues from young and aged monkeys. Representative images are shown on the left. SMA-positive cells are quantified as fold changes of their numbers (Aged vs. Young), and shown as means ± SEM on the right. Young, n = 4; aged, n = 4 monkeys. Scale bars, 20 μm.
