Figure 3.

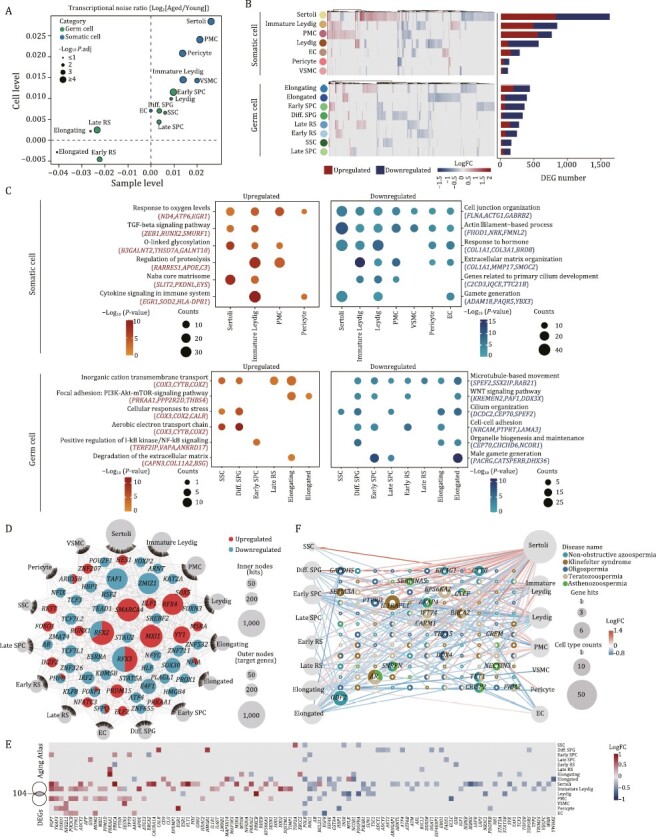
Cell type-specific and aging-related transcriptomic signatures in NHP testes. (A) Scatter plot showing the log2 ratio of transcriptional noise in the aged group compared to the young group calculated using sample averages (n = 8) or single cells on the X and Y axes, respectively. (B) Heatmaps and bar plots showing the expression levels and numbers of aging-related DEGs. Left, heatmaps showing the expression levels of aging-related DEGs across somatic and germ cell types. Each row represents one cell type and each column represents one aging-related DEG. Right, bar plots showing the numbers of upregulated and downregulated aging-related DEGs across cell types. (C) Dot plots showing the representative GO terms enriched for aging-related DEGs across somatic or germ cell types in the monkey testes. (D) Network visualization of upregulated and downregulated core regulatory TFs in 15 different testis cell types in the aged group compared to the young group. Internodes represent core TFs and node size positively correlates with the number of target genes regulated by specific TF. Outer nodes represent cell types and node size positively correlates with the number of target genes differentially expressed in corresponding cell types, respectively. (E) Heatmap showing the expression levels of aging-related DEGs associated with Aging Atlas database across different cell types in monkey testes. (F) Network plot showing DEGs associated with testicular diseases in different cell types of the monkey testes. The node size of cell types positively correlates with the number of DEGs in indicated cell types. The node size of genes positively correlates with the number of cell types differentially expressed in and the number of diseases contributes to. The outer ring of each gene node represents different testicular disease types, respectively.
