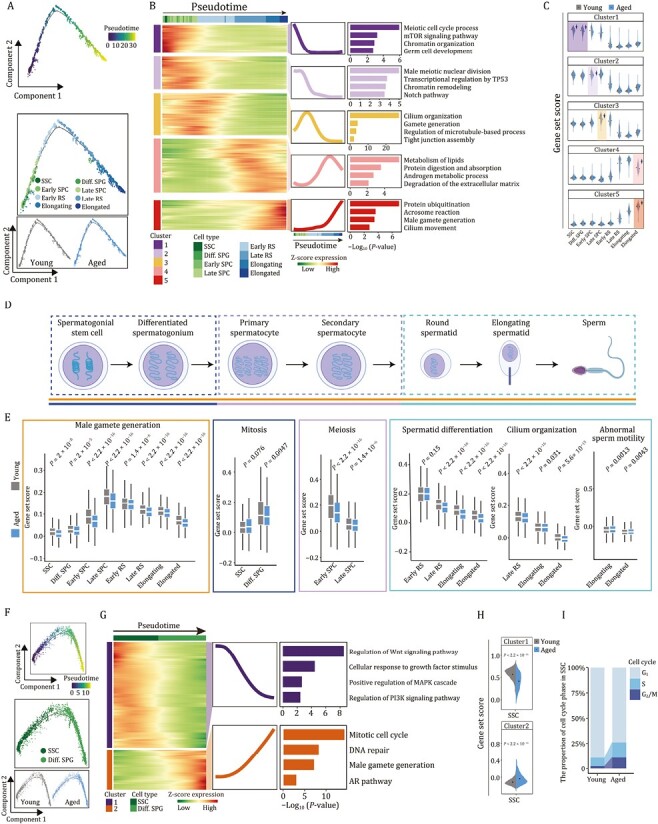
Figure 4.

Aging-associated molecular profiling along the differentiation trajectories of spermatogenesis in NHP testes. (A) Pseudotime analysis of germ cells along the spermatogenesis process in monkey testes. Top, pseudotime scores of germ cells. Middle, the distribution of different germ cell types along the pseudotime trajectory. Bottom, the distribution of young and aged groups along the pseudotime trajectory. (B) Heatmaps, curve charts and bar plots showing the expression profiles of the top 1,000 genes that change along the pseudotime trajectory. According to the expression pattern, the top differentially expressed genes (DEGs) were divided into five clusters. Left, heatmap showing the expression levels of the top DEGs. Right, curve charts and bar plots showing the expression patterns and enriched GO terms of the corresponding pattern. (C) Violin plots showing the gene set scores of genes in different clusters in young and aged groups along the spermatogenesis process. (D) Schematic diagram showing the main stages of spermatogenesis. (E) Box plots showing the representative gene set scores of each spermatogenic-stage as shown in (D). (F) Pseudotime analysis of spermatogonia in monkey testes. Top, pseudotime scores of spermatogonia in monkey testes. Middle, the distribution of two spermatogonial cell types (SSC and Diff. SPG) along the pseudotime trajectory. Bottom, the distribution of young and aged groups along the pseudotime trajectory. (G) Heatmaps, curve charts and bar plots showing the expression profiles of the top 400 genes that change along the pseudotime trajectory. According to the expression pattern, the top differentially expressed genes (DEGs) were divided into two clusters. Left, heatmaps showing the expression levels of the top DEGs. Right, curve charts and bar plots showing the expression patterns and enriched GO terms of the corresponding pattern. (H) Violin plots showing the gene set scores of genes in cluster 1 and 2 in young and aged SSCs. (I) Bar plot showing the distribution of cell cycle phase in SSCs from young and aged groups.
