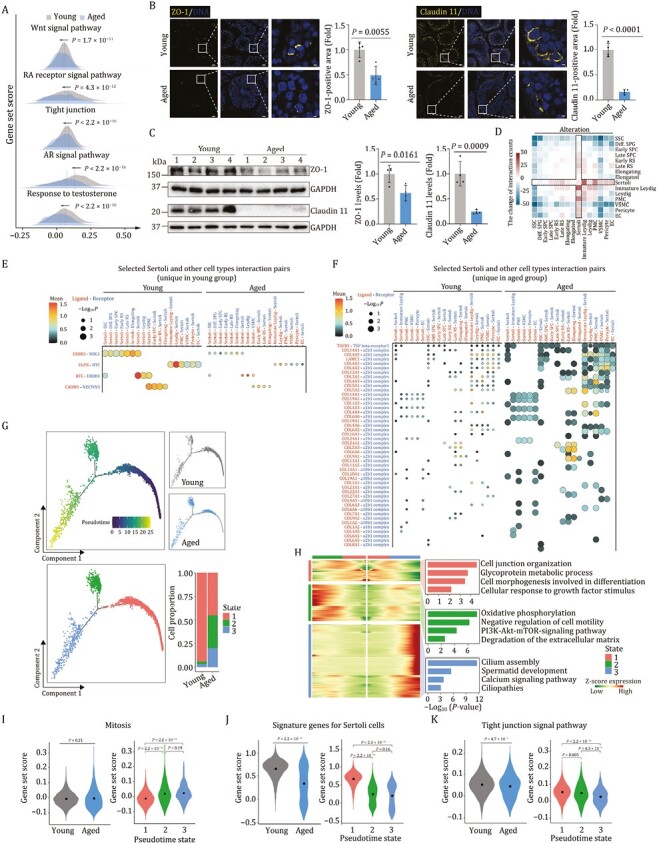
Figure 5.

Dysregulation of Sertoli cells is identified as a crucial contributor to hostile microenvironment in aged NHP testes. (A) Ridge plots showing the representative gene set scores for Sertoli cells in young and aged groups. (B) Immunofluorescence analysis of ZO-1, Claudin 11 expression in testicular tissues from young and aged monkeys. Representative images are shown on the left. ZO-1 or Claudin 11-positive areas are quantified as fold changes (Aged vs. Young), and shown on the right. Young, n = 4; aged, n = 4 monkeys. Scale bars, Scale bars: 20 μm and 3.3 μm (zoomed-in image). (C) Western blot analysis of ZO-1, Claudin 11 protein expression in testicular tissues from young and aged monkeys. Left, representative images. Right, protein levels are quantified as fold changes (Aged vs. Young), and shown as means ± SEM. Young, n = 4; aged, n = 4 monkeys. (D) Heatmap showing the aging-related alteration of cell–cell interaction numbers across cell types in monkey testes. (E) Dot plot showing the selected interaction pairs unique in young group between Sertoli and other cell types in monkey testes. (F) Dot plot showing the selected interaction pairs unique in aged group betweenSertoli and other cell types in monkey testes. (G) Pseudotime analysis of Sertoli cells in monkey testes. Upper left, pseudotime scores of Sertoli cells in monkey testes. Upper right, the distribution of young and aged groups along the pseudotime trajectory. Lower left, the distribution of different Sertoli subtypes (named as state 1, state 2, and state 3) along the pseudotime trajectory. Lower right, bar plot showing the distribution of Sertoli subtype proportion between young and aged groups. (H) Expression profiles of top 500 DEGs and their enriched GO terms for different clusters along the pseudotime trajectory. Left, heatmaps showing the expression profiles of top 500 DEGs for different clusters along the pseudotime trajectory. Right, the enriched GO terms of genes in each cluster. (I) Violin plots showing the gene set scores for mitosis-related genes. Left, mitosis gene set scores in young and aged groups. Right, mitosis gene set scores for different states of Sertoli cells along the pseudotime axis. (J) Violin plots showing the gene set scores for the signature genes for Sertoli cells (top 50 marker genes of Sertoli cells ranked by LogFC). Left, Sertoli signature gene set scores in young and aged groups. Right, signature gene set scores for different states of Sertoli cells along the pseudotime axis. (K) Violin plots showing the gene set scores for genes involving in tight junction signal pathway. Left, tight junction signal pathway gene set scores in young and aged groups. Right, tight junction signal pathway gene set scores in different states of Sertoli cells along the pseudotime axis.
