Figure 5.
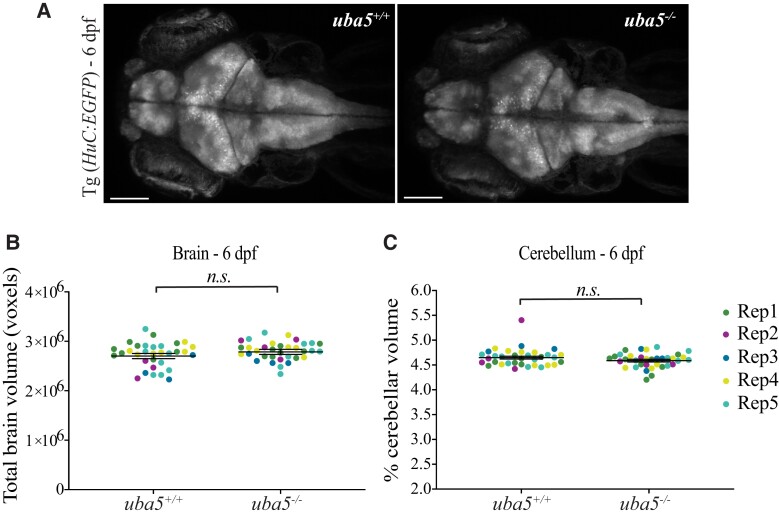
Quantification of total brain and cerebellar volume in uba5ex1s/ex1s animals at 6 dpf. (A) Maximum intensity projections of whole brain from Tg (Huc:EGFP); uba5+/+ and Tg (Huc:EGFP); uba5ex1s/ex1s 6 dpf zebrafish. (B) Total brain and (C) cerebellar volume analyses showed no significant changes in uba5ex1s/ex1s (brain volume n = 9, 4, 4, 8, 9; cerebellar volume n = 10, 4, 4, 8, 9) compared to uba5+/+ (brain volume n = 9, 3, 3, 7, 10; cerebellar volume n = 8, 4, 3, 9, 10). Each dot represents an individual zebrafish. Data represents raw data for five biological replicates plotted with the mean ± SD predicted by the mixed model statistical test. Scale bar = 100 µm. n.s., non-significant; Rep, replicate.

