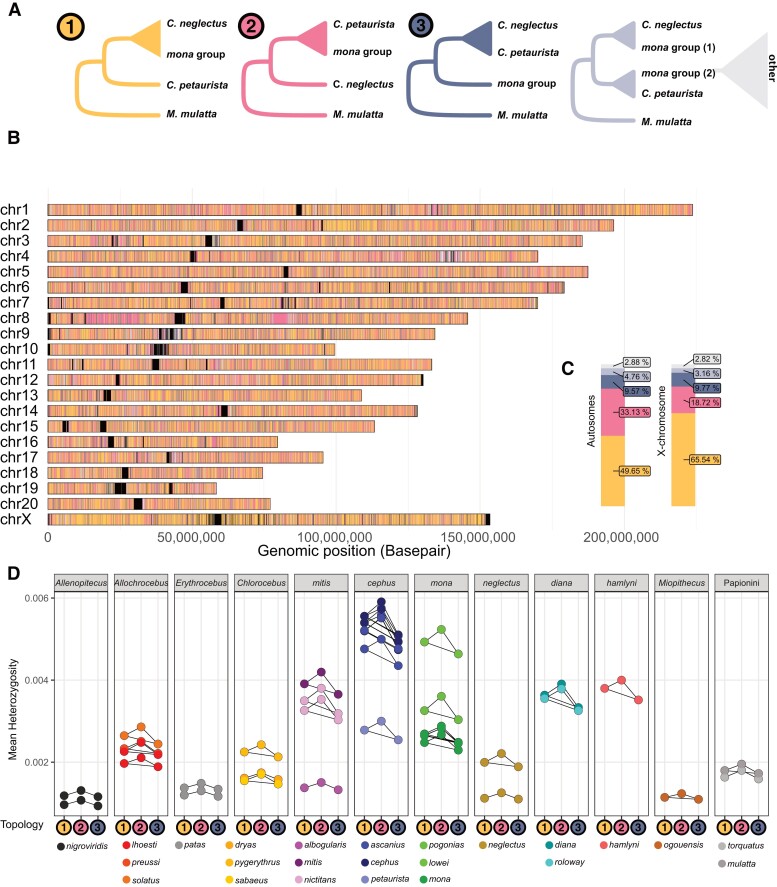
Fig. 5.
Distribution, prevalence and heterozygosity of introgressed genomic segments. (A) Five possible tree topologies obtained from 25 kb genomic windows for the introgression event A1 (Fig. 3), involving C. neglectus, mona, and cephus groups (here represented by C. petaurista), rooted with M. mulatta as outgroup. Tree 1 groups the lineages according to the species tree. Tree 2 groups the mona group species and C. petaurista monophyletically to the exclusion of C. neglectus and can be caused by ancestral introgression or ILS. Tree 3 places the C. petaurista with C. neglectus and is expected to be caused only by ILS. The remaining 2 trees (light blue and gray) represent more complex topologies, which could be caused by, e.g. more recent introgression or ILS. (B) The genomic location of the different tree topologies along the M. mulatta chromosomes, and (C) their relative abundance on the autosomes and the X-chromosome. Black blocks in (B) correspond to regions of the genome with insufficient information for inferences, frequently located around centromeres and telomeres. (D) Heterozygosity in windows corresponding to Tree 1, Tree 2, and Tree 3 topologies (shown as colored circles along the x axis) calculated for all samples and species. Connectors show significant within-sample differences in heterozygosity between tree topologies, as assessed by ANOVAs followed by post hoc Tukey's tests corrected for multiple testing.

