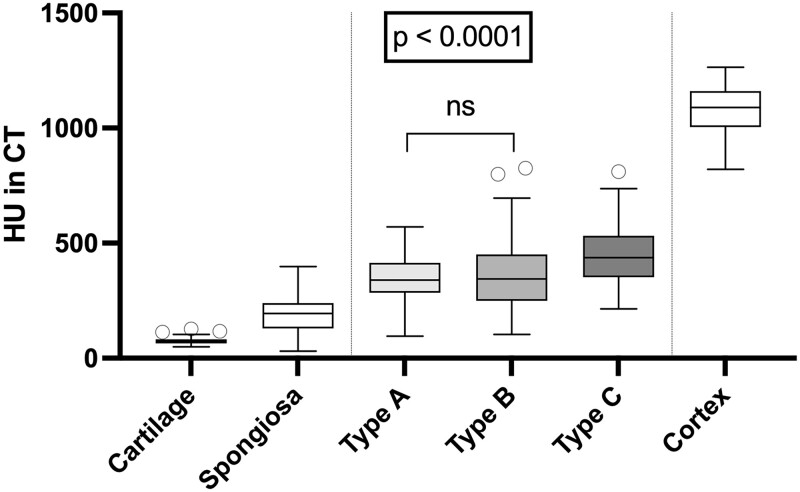
Figure 4.
CT attenuation measurement of three types of joint space lesions and three normal tissue structures. All lesions show higher HU values compared with normal cartilage and spongious bone but lower HU values than cortical bone. Type C lesions have higher HU values than the other lesion types. Except for the difference in HU between type A and B lesions, all differences are significant

