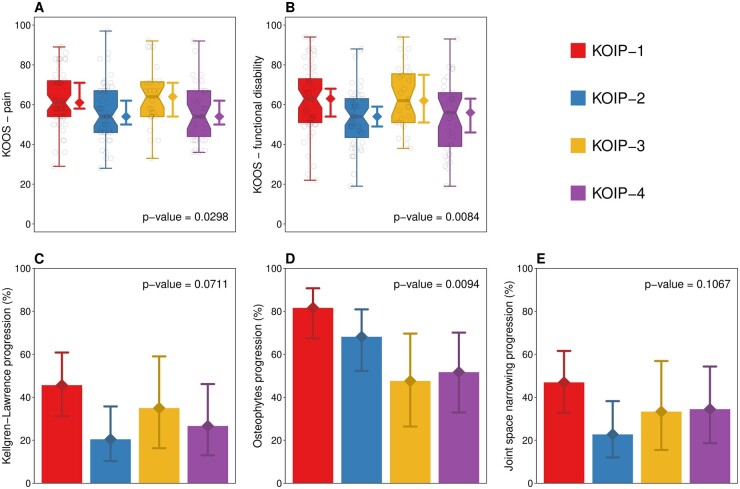
Figure 2.
Association of knee osteoarthritis inflammatory phenotypes (KOIP) with clinical severity and radiographic progression. Panels (A) and (B) represent boxplots showing the distribution of knee injury and osteoarthritis outcome scores (KOOS, reversed scores) across KOIP groups for pain (A) and functional disability (B). Panels (C), (D) and (E) display the percentage of patients whose disease progressed after a two-year follow-up according to different radiographic criteria, namely Kellgren–Lawrence (KL) stage (C), formation of new osteophytes (D) and increase of joint space narrowing (JSN) (E). Diamond-shaped points and segments show group medians (A and B), percentages (C, D and E) and their 95% CI. P-values are derived from an Kruskal–Wallis test (A, B) or a Fisher’s test for contingency tables (C, D and E). KOIP: knee osteoarthritis inflammatory phenotype; KOOS: knee injury and osteoarthritis outcome scores (reversed scores)

