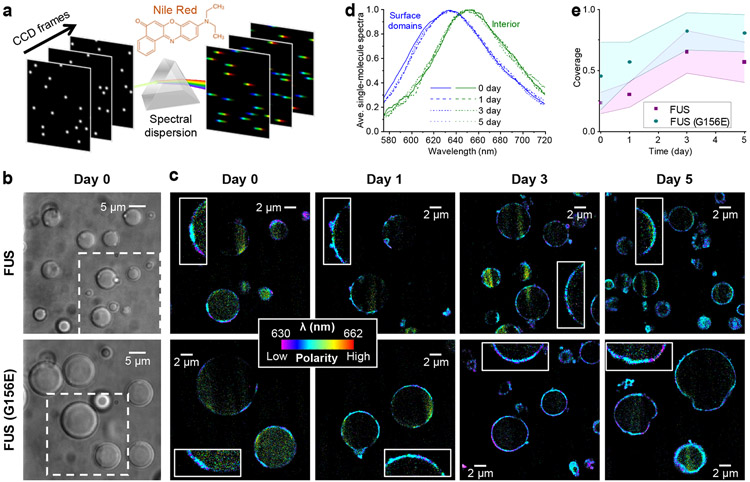
Figure 1.
SR-SMLM with Nile Red unveils growing hydrophobic (low chemical polarity) nanodomains at the FUS condensate surface. a. Schematics: Single-molecule fluorescence is spectrally dispersed in the wide field, and the resultant single-molecule spectra are accumulated over many camera frames to generate SR-SMLM images. b. Brightfield micrographs of condensates formed by wild-type (top) and G156E-mutant (bottom) FUS. c. Nile Red SR-SMLM images for FUS (top) and FUS(G156E) (bottom) condensates aged for different days. Color presents the mean wavelength of the local single-molecule spectra (color scale bar), which reflects the local chemical polarity. The Day 0 images correspond to the boxed regions in (b). Insets: Zoom-ins of the condensate surfaces, highlighting the hydrophobic nanodomains. d. Averaged single-molecule spectra at the condensate surface hydrophobic domains (blue) and the condensate interior (green), for FUS condensates aged for different days (different line shapes). e. Time-dependent surface coverage of the Nile Red-visualized hydrophobic domains over aging. Data points and shades present the averages and standard deviations of individual condensate droplets (~10 for each data point), respectively.

