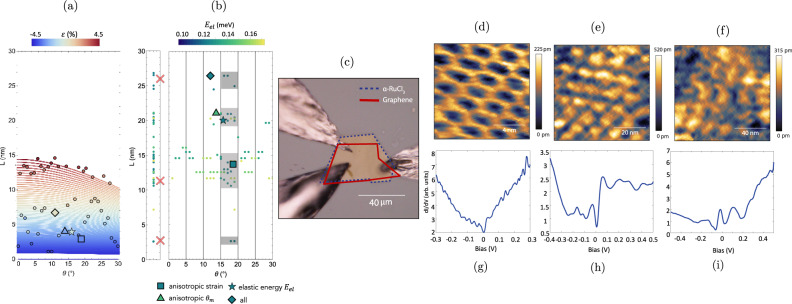
Fig. 4. GR/α-RuCl3 superlattices: InterMatch predictions vs. experiment.
a Parametric period (L) vs angle (θ) curves with isotropic strain ε in GR according to the model in ref. 42. The color scale indicates the sign and magnitude of isotropic strain in GR for each parametric curve. Overlaid are points denoting InterMatch search results for superlattices having only isotropic strain in GR with θm = 60°. b InterMatch predictions for low-energy GR/α-RuCl3 superlattice configurations accounting for anisotropic strain, elastic energy Eel, and 59° ≤ θm ≤ 61°. Left panel is a projection onto the L-axis. Shaded gray boxes indicate regions of likely superlattice configurations. Enlarged plot markers (square, triangle, star, diamond) correspond to search criteria that can lead to longer superlattice periods observed in experiment. Red crosses denote the periodicities extracted from the experiment. Source data are provided as a Source Data file. c Optical image of the measured device of GR/α-RuCl3 contacted with bismuth indium tin for the STM measurements. The blue and red dashed lines show the boundary of α-RuCl3 and graphene, respectively. d–f STM topographic images (in pm) of GR/α-RuCl3 on 2.7 nm (set points of −100 mV and −100 pA), 11.7 nm and 25.7 nm (set points of −1 V and −50 pA) moiré patterns due to atomic reconstruction. g–i dI/dV measurements corresponding to the three moiré patterns in (d)–(f) showing strong resonances dependent on moire wavelengths.

