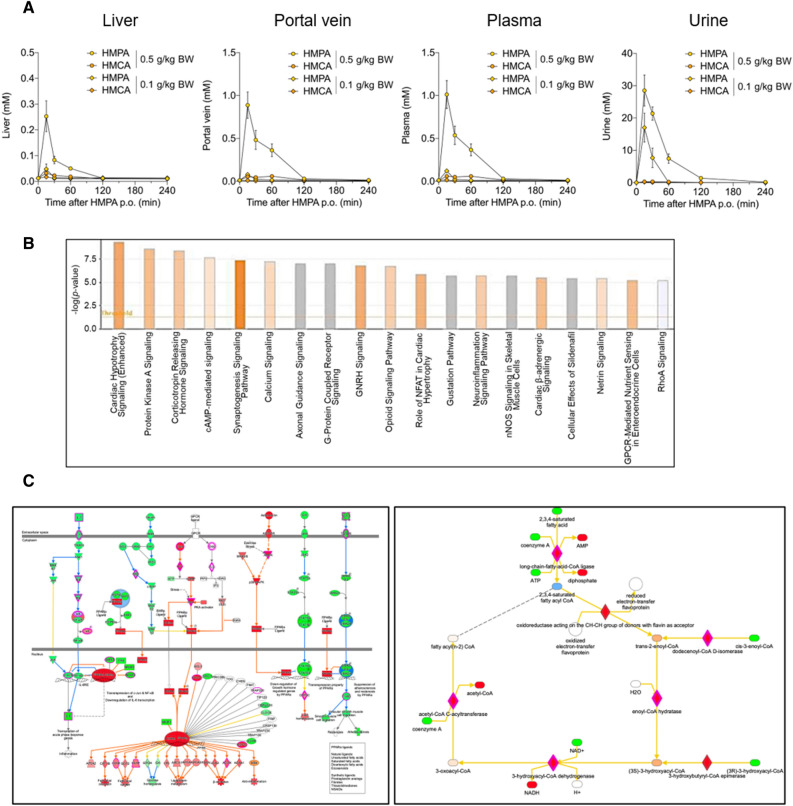
Figure 2.
Pharmacokinetic profiles of HMPA and RNA-Seq transcriptome analysis of the liver following HMPA administration. (A) After oral administration of HMPA (0.1 and 0.5 g/kg bodyweight, respectively), HMPA and HMCA contents in the liver, portal vein, plasma, and urine samples were determined at 0, 15, 30, 60, 120, and 240 min after administration (n = 4). (B) Top canonical pathways by functional enrichment analysis of differentially expressed genes. P-values were adjusted based on the false discovery rate (FDR). (C) Gene networks including Upstream Regulator Analysis and Molecule Activity Predictor. Activation state of individual genes predicted by the Ingenuity Pathway Analysis with downstream predicted activation of protein kinase A (PKA) signaling. All data are presented as the mean ± standard error of mean. BW, bodyweight; p.o., per os.

