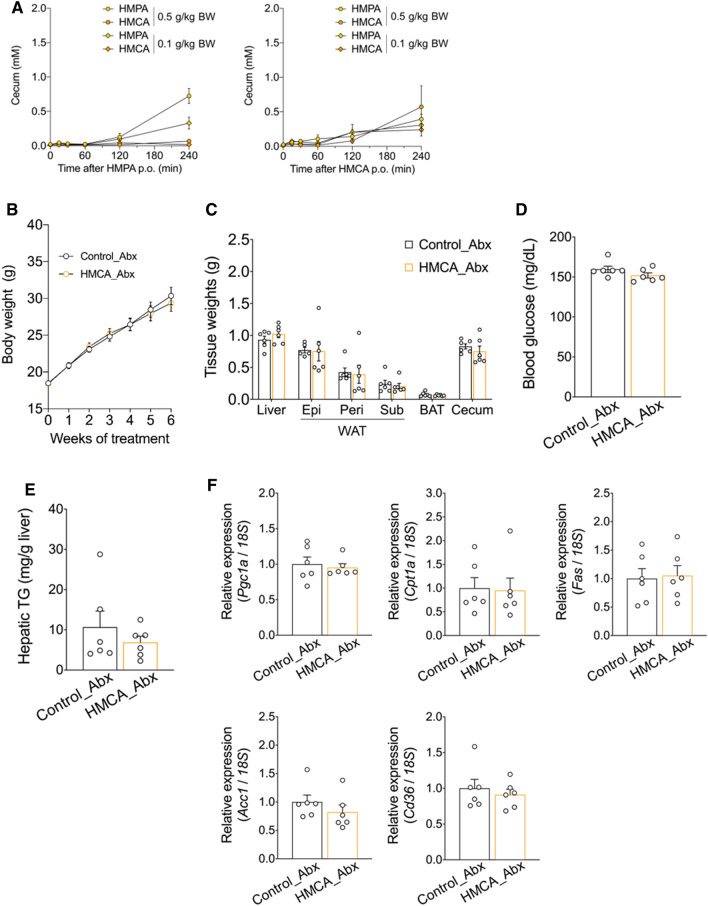
Figure 4.
Metabolic parameter changes in HMCA-supplemented HFD-fed mice during antibiotic treatment. (A) After the oral administration of HMPA (left) or HMCA (right) (0.1 and 0.5 g/kg bodyweight, respectively), HMPA and HMCA contents in the cecum were determined (n = 4). (B) For 5 weeks, antibiotics-treated C57BL/6J wild-type male mice were fed HFD containing 1% HMCA. Bodyweight gain during HMCA treatment (n = 6 per group). (C) Mass of the liver, WAT, BAT, and cecum (n = 6 per group). (D) Blood glucose level (n = 6 per group). (E) Hepatic TG contents (n = 6 per group). (F) Relative mRNA expressions involved in lipid metabolism in the liver of HFD control mice and HMCA-supplemented HFD-fed mice (n = 6 per group). The results are presented as the fold change in mRNA expression relative to the HFD control, with a value of 1 assigned to the control group. To compare the mRNA expression levels across different samples, the copy numbers of all transcripts were normalized to the expression levels of 18S mRNA as an internal control. All data are presented as the mean ± standard error of mean. BW, bodyweight; HFD, high-fat diet; WAT, white adipose tissue; Epi, epididymal white adipose tissue; peri, perirenal white adipose tissue; sub, subcutaneous white adipose tissue; BAT, brown adipose tissue; TG, triglyceride; Abx, antibiotics.

