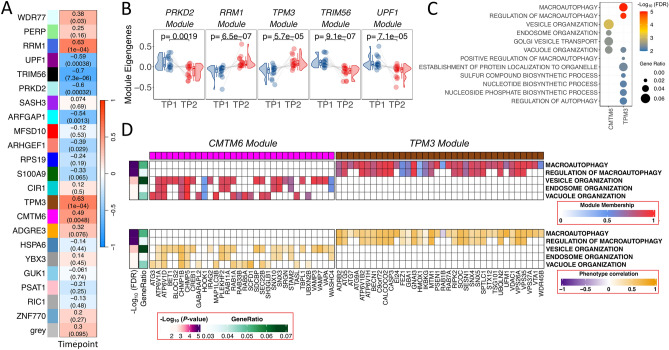
Figure 3.
Co-expression analysis in ACD patients. (A) Correlation values heatmap obtained from WGCNA module analysis of co-expressed genes in ACD patients. Upper value corresponds to the individual correlation value of the module with musical stimuli. P-values of these correlations are shown in brackets (B) Raincloud plots of differences in individual samples eigengenes between TP1 and TP2 from modules showing the largest statistical significance in ACD patients. (C) Top biological processes detected from most statistically significant modules. Modules with significant pathways are named as the hub gene names CMTM6 and TPM3. (D) Module membership (MM) and phenotype correlation (musical stimuli) for genes from the most significant pathways obtained from the modules CMTM6 and TPM3.

