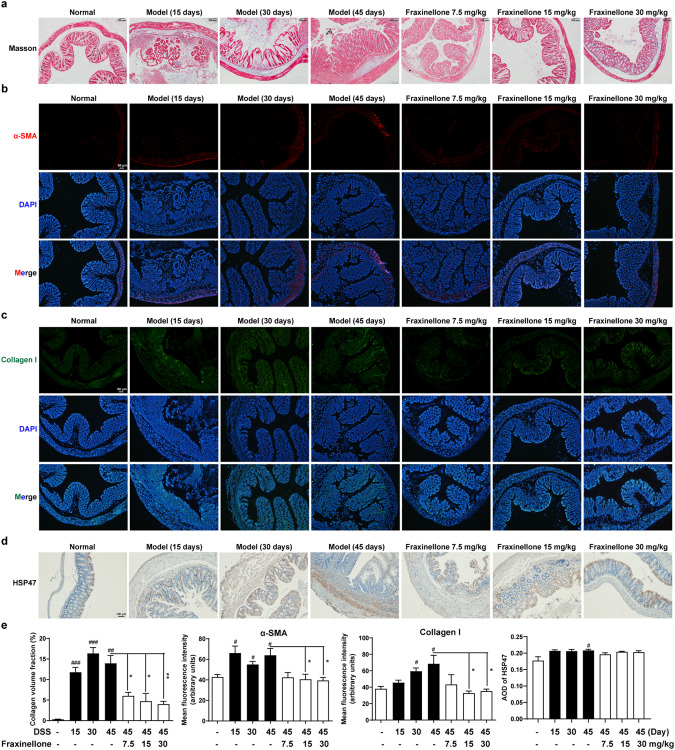
Fig. 2. Fraxinellone treatment inhibited DSS-induced fibrosis in mice.
a Masson staining of colorectal tissue sections, Scale bar, 100 µm. b, c Immunofluorescence staining of α-SMA and Collagen I, Scale bar, 50 µm. d Colon tissue sections from each group were stained for HSP47. Scale bar, 100 µm. e Statistical analysis of (a–d). Data are presented as the mean ± SEM (n = 3–5 per group). #P < 0.05, ##P < 0.01, ###P < 0.001 vs. control group, *P < 0.05, **P < 0.01 vs. DSS model group.

