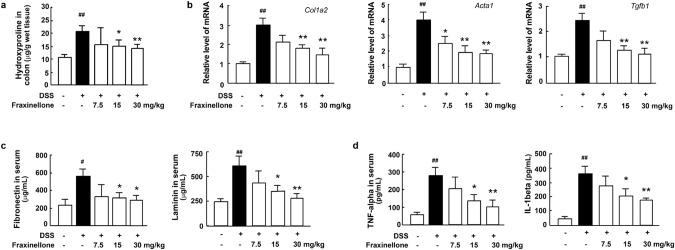
Fig. 3. Fraxinellone treatment reduced the levels of fibrosis biomarkers and cytokines.
a The level of colon hydroxyproline. b The mRNA expression levels of Col1a2, Acta1, and Tgfb1. c Serum fibronectin and laminin levels. d The levels of serum TNF-alpha and IL-1beta. Data are presented as the mean ± SEM (n = 5 per group). #P < 0.05, ##P < 0.01 vs. control group, *P < 0.05, **P < 0.01 vs. DSS model group.

