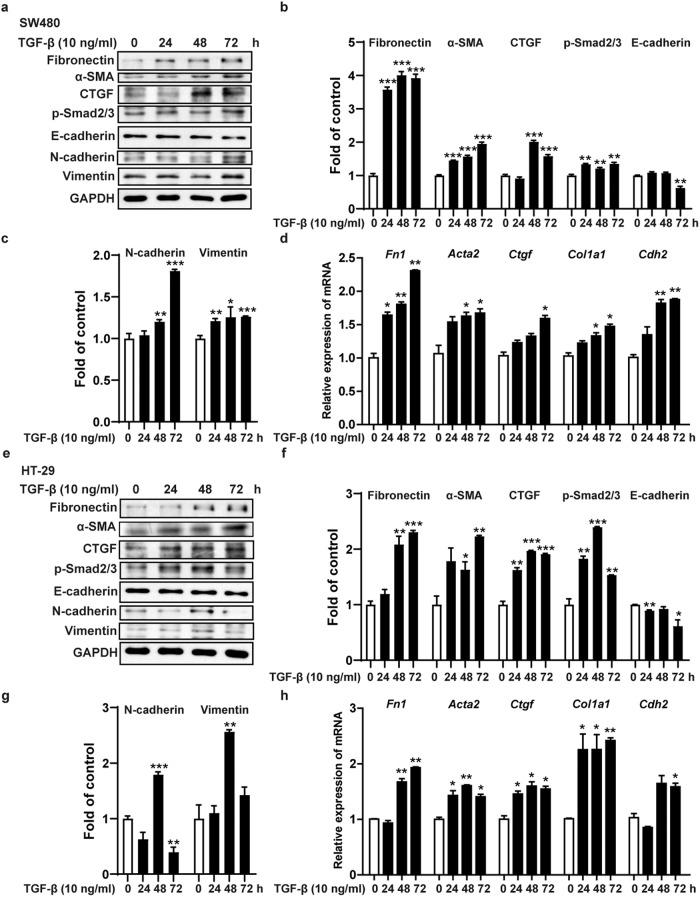
Fig. 4. TGF-β induced the formation of cell fibrosis models in vitro.
a–c, e–g Immunoblot analysis of fibronectin, α-SMA, CTGF, p-Smad2/3, E-cadherin, N-cadherin, Vimentin and GAPDH. d, h The mRNA expression levels of Fn1, Acta2, Ctgf, Col1a1 and Cdh2. Data are presented as the mean ± SEM. *P < 0.05, **P < 0.01, ***P < 0.001 vs. 0 h.

