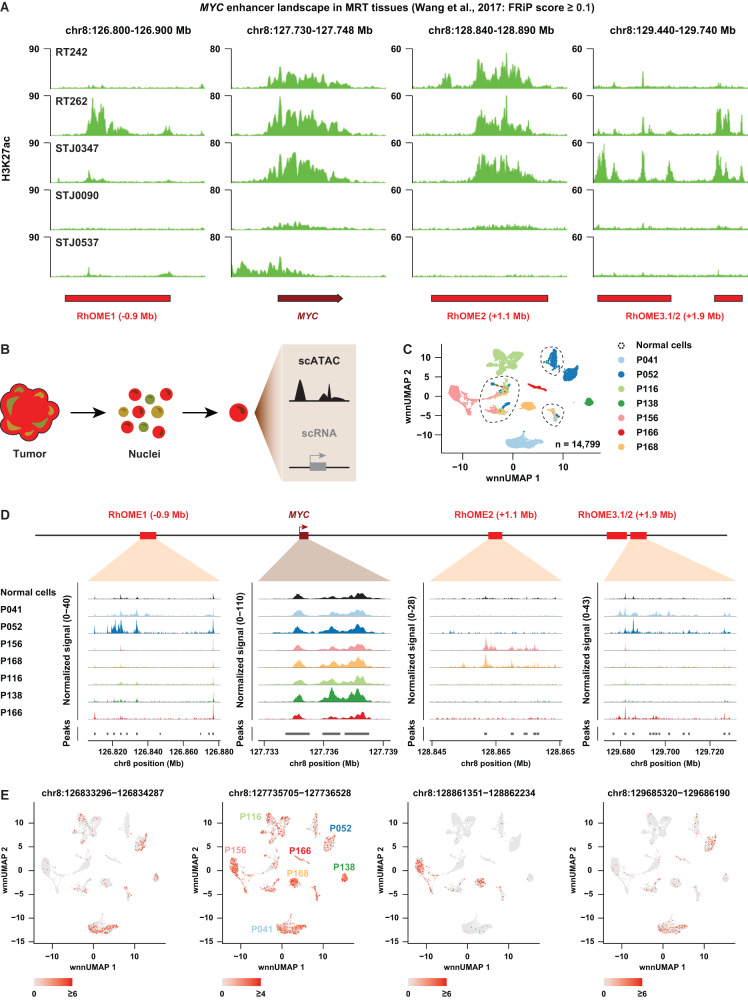
Fig. 5. Analyses of MRT tissues reveal inter- and intra-tumor heterogeneity of MYC enhancer landscape.
A Genomic tracks depicting H3K27Ac signal at the MYC locus from publicly available H3K27Ac ChIP-seq data40. Data was filtered based on an average FRiP score of higher than 0.1. B Acquisition of single-cell Multiome data (gene expression + ATAC-seq) from MRT tissues using Chromium 10x Genomics platform. C UMAP discriminating tumor cells, but not normal cells, from the MRT tissues derived from different patients (n = 1 per patient). Tumor cells cluster separately while normal cells are depicted as a mixed population from different patients. D A pseudo-bulk view of scATAC-seq reads at the MYC locus for 7 MRT patients. E UMAP depicting RhOME specific peak signal within each single cell (n = 1 per patient).

