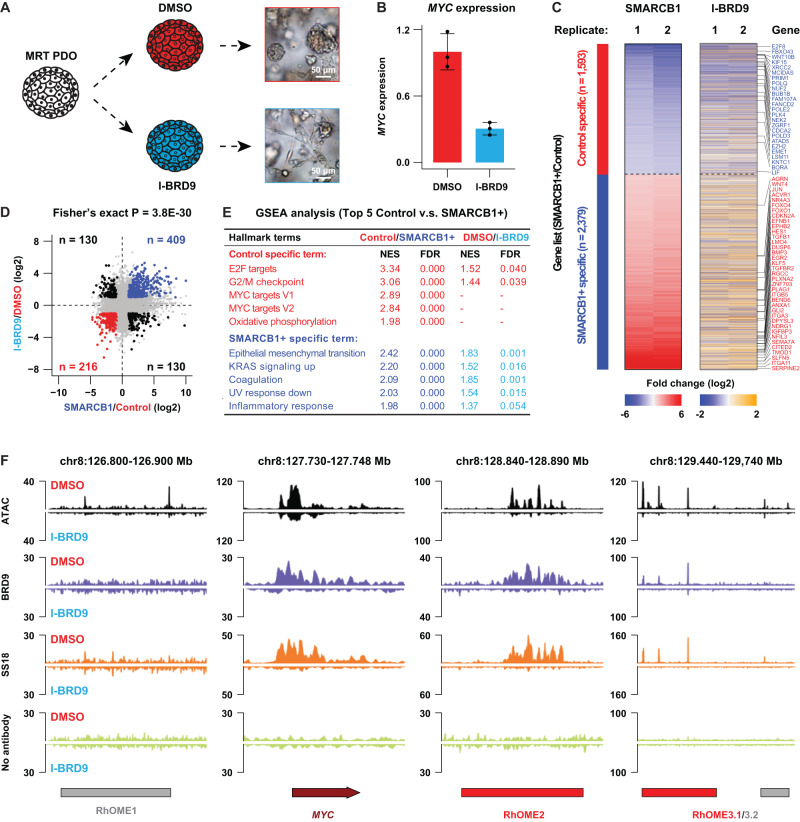
Fig. 6. A therapeutic strategy for MRT patients via targeting a ncBAF subunit named BRD9 using a pharmacological inhibitor.
A Schematic representation of the experiment and brightfield images showing a differentiation phenotype upon BRD9 inhibition in MRT PDOs (adapted from Custers et al.11). B RT-qPCR for MYC in P103 treated with DMSO or I-BRD9 (10 μM). Data is represented as means ± SD (n = 3 independent experiments). Source data are provided as a source data file. C Heatmaps showing the transcriptomic changes of differential expressed genes between SMARCB1+ and Control in either SMARCB1 reconstitution or BRD9 inhibition experiments (n = 2). D Correlation of transcriptomic changes of SMARCB1 reconstitution with BRD9 inhibition. Upper right panel show all genes significantly upregulated in both experiments (blue dots) (n = 2). Lower left panel represent all genes specific for control condition in both experiments (red dots). Statistical significance was calculated by a fisher’s exact test. E GSEA analyses showing top five hallmark gene sets identified in the SMARCB1 reconstitution and the corresponding differential expression analysis after BRD9 inhibition. F Chromatin occupancy at the MYC locus 5 days after I-BRD9 treatment depicting ATAC-seq and CUT&RUN for BRD9 and SS18. No antibody was included as the negative control.

