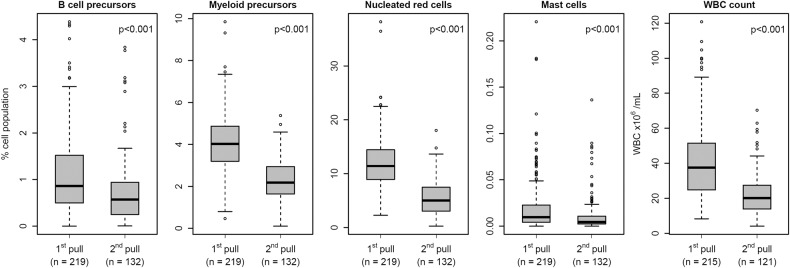
Fig. 1. Distribution of bone marrow (BM)-associated cell populations and white blood cell (WBC) count in first and second pull BM aspirated samples.
The figure shows the distribution of percentages (of normal cellularity) for B cell precursors, myeloid precursors, nucleated red cells, and mast cells, and BM sample WBC count in first pull vs second pull BM samples. Extreme outlier omitted from plot at 0.62% for mast cells for graphical presentation. p < 0.001 for all comparisons.

