
Fig. 3. Distribution of the bone marrow quality index (BMQI) in first and second pull bone marrow (BM) aspirated samples.
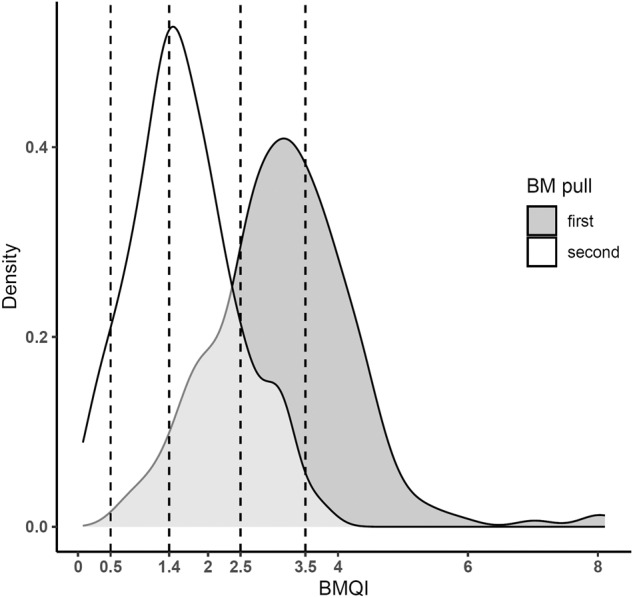
The figure shows the distribution of BMQI in first (in grey; n = 219) and second (in white; n = 132) pull BM aspirated samples as a density plot. The dotted lines represent the BMQI values for corresponding likelihood ratios of belonging to a class of first pull samples of 0.1 (BMQI = 0.5), 0.2 (BMQI = 1.4), 1 (BMQI = 2.5), and 10 (BMQI = 3.5) and used to classify samples in the BMQI scoring system.