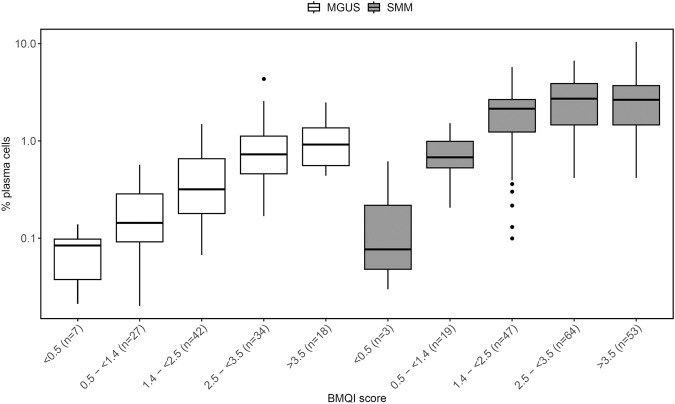
Fig. 4. Distribution of the bone marrow (BM) plasma cell percentage in groups of monoclonal gammopathy of undetermined significance (MGUS) and smoldering multiple myeloma (SMM) samples defined by the bone marrow quality index (BMQI) score.
The figure illustrates the total plasma cell percentage (of total nucleated cells) distribution in BM aspirated samples, grouped by BMQI score for MGUS on the left (in white) and SMM in the right (in gray). For MGUS, p < 0.05 (<0.5 vs. 1.4- < 2.5 and 1.4- < 2.5 vs. 2.5- < 3.5); p < 0.01 (1.4- < 2.5 vs. ≥3.5); and p < 0.001 (2.5-< 3.5 vs. ≥3.5 and 0.5- < 1.4 vs. 2.5- < 3.5 and ≥3.5). For SMM, p < 0.05 (<0.5 vs. 2.5- < 3.5); p < 0.01 (0.5- < 1.4 vs. 1.4- < 2.5); and p < 0.001 (0.5- < 1.4 vs. 2.5- < 3.5 and ≥3.5).

