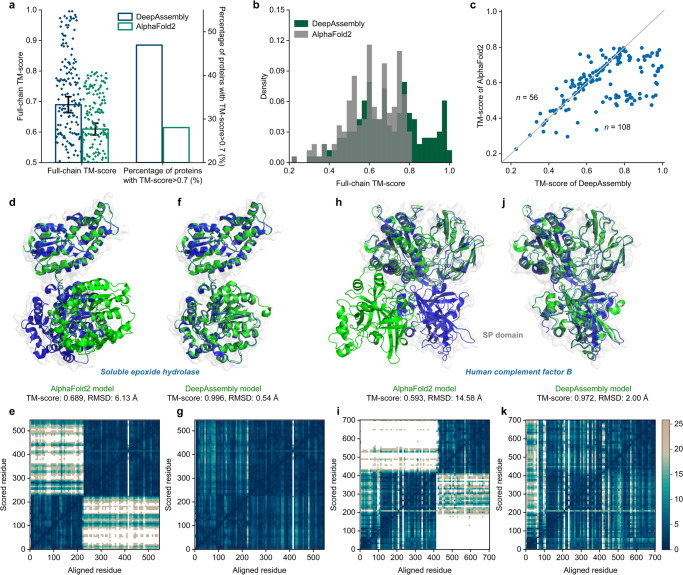
Fig. 4. DeepAssembly corrects the inter-domain orientation of multi-domain protein structures in AlphaFold database.
a Average TM-score over 164 multi-domain proteins for DeepAssembly and AlphaFold2. The y-axis on the right represents the percentage of targets with TM-score>0.7. Error bars are 95% confidence intervals. b Distribution of the full-chain TM-score for the predicted models. c Head-to-head comparison of the TM-score value on each test case between DeepAssembly and AlphaFold2. “n” refers to the number of points on either side of the diagonal. Predicted models of AlphaFold2 (d, h) and DeepAssembly (f, j) for soluble epoxide hydrolase (PDB ID: 3WK4_A) and human complement factor B (PDB ID: 2OK5_A). Experimentally determined structures are colored in blue, and the predicted models are colored in green. PAE plots for the predicted models by AlphaFold2 (e, i) and DeepAssembly (g, k). The color at (x, y) corresponds to the expected distance error in residue y’s position, when the prediction and true structure are aligned on residue x.

