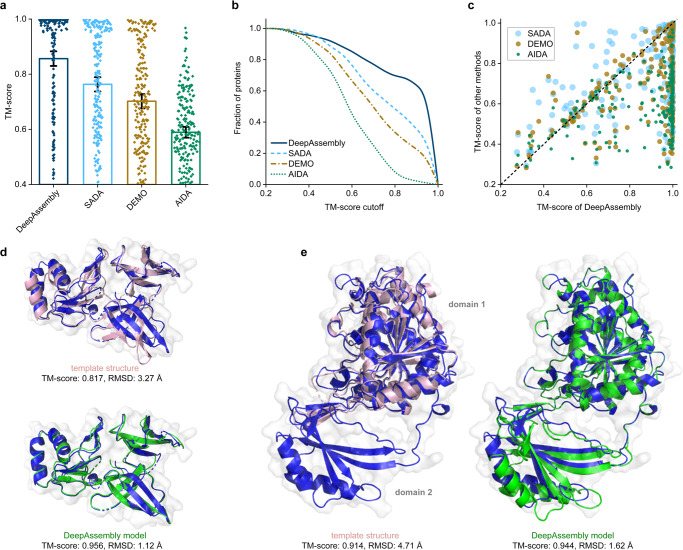
Fig. 8. Results of assembling experimental domain structures.
a Average TM-scores of the assembly models by DeepAssembly, SADA, DEMO and AIDA (n = 219 proteins). Error bars are 95% confidence intervals. b Comparison between DeepAssembly, SADA, DEMO and AIDA on 219 multi-domain proteins based on the fraction of proteins with TM-score higher than each TM-score cutoff. c Head-to-head comparison of the TM-scores on each test case between DeepAssembly and other methods. Examples of the assembly structures built by DeepAssembly for 3KBG_A (d) and 2D1C_A (e). Experimental structures are colored in blue, the predicted models are colored in green, and the remote templates searched by PAthreader are colored in pink.

