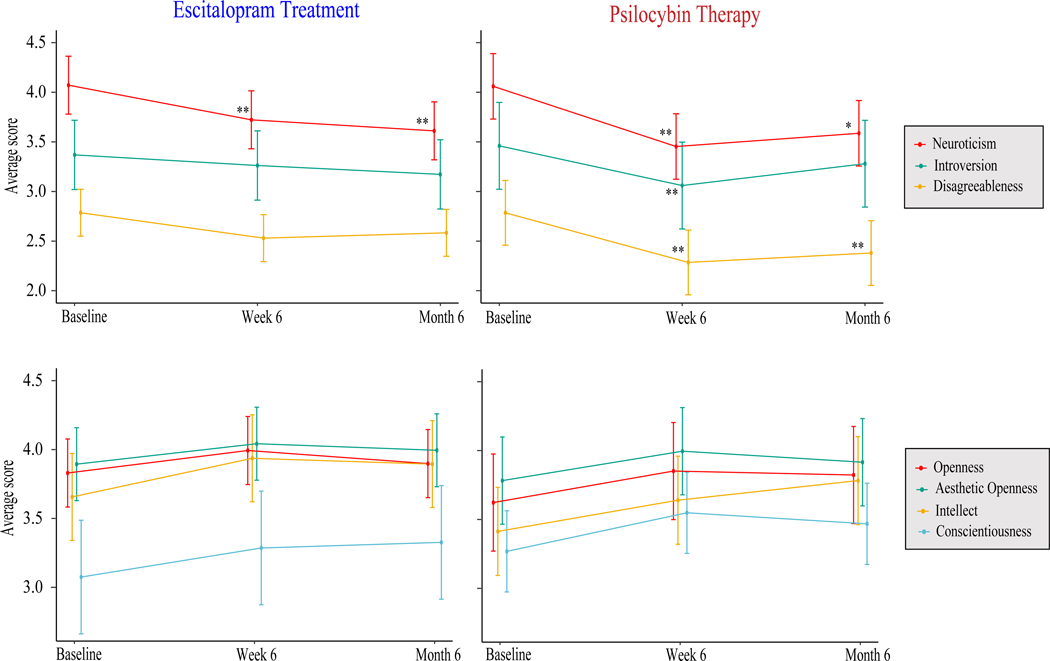
Figure 3.
Line plots illustrate self-reported mean changes in personality outcomes between Baseline, Week 6, and Month 6. ET-induced changes are represented on the left, whereas PT-induced changes are on the right. Error bars reflect 95% confidence intervals around the means. *p < 0.01, **p < 0.005.

