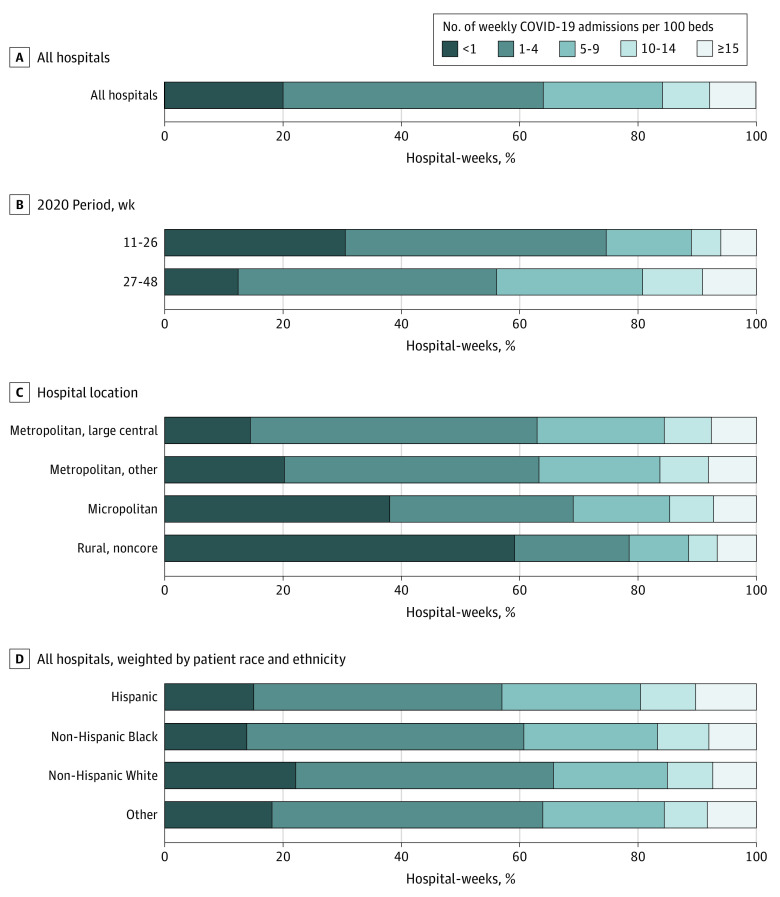
Figure 1. Distribution of Hospital-Weeks by COVID-19 Admission Rate, 2020 Weeks 11 to 48.
A, All hospitals. B, Time period in 2020. C, Hospital location. D, Weighted by number of admissions in 2019 by patient race and ethnicity. Other race and ethnicity includes American Indian or Alaska Native, Asian or Pacific Islander, or multiple races or ethnicities. Analyses related to patient race and ethnicity excluded 5 states that had more than 5% of these data missing (Louisiana, Montana, North Dakota, Nebraska, and West Virginia). In A to D, all statistics were calculated using hospital-level weights equal to the number of admissions in 2019. For each panel, the reference category is the first one listed. For all other categories, the difference between their distribution and that of the reference category is statistically significant at the 1% level. Data were obtained from the Agency for Healthcare Research and Quality Healthcare Cost and Utilization Project State Inpatient Databases (2019-2020) for 45 US states.

