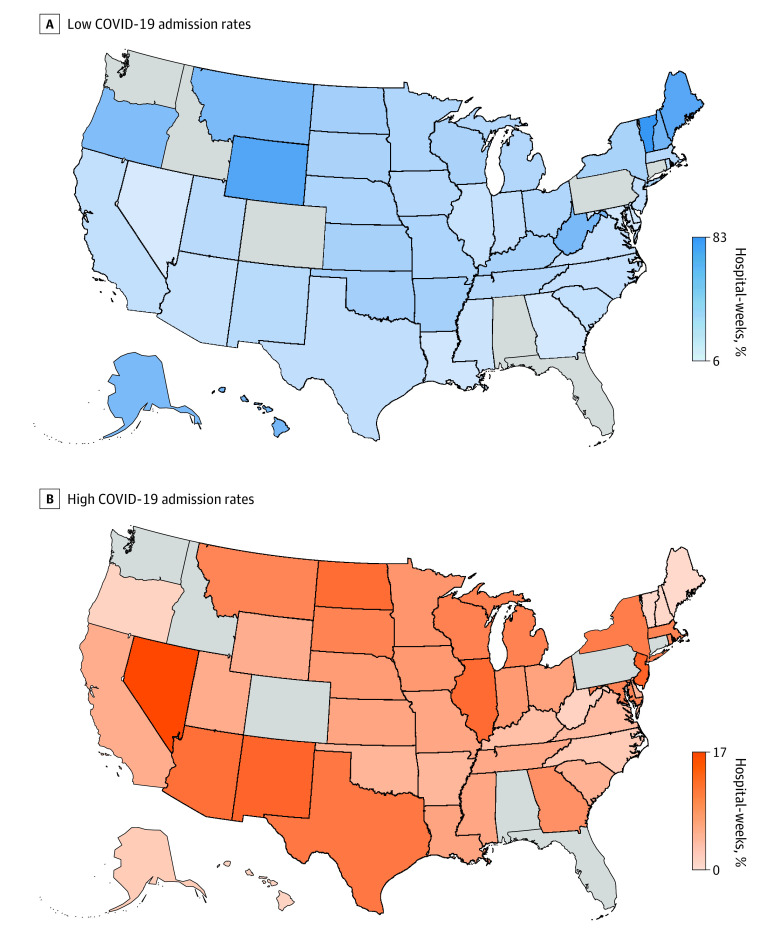
Figure 2. Hospital-Weeks With Low or High COVID-19 Admission Rates, 2020 Weeks 11 to 48.
A and B, Percentage of low (<1 weekly admission per 100 beds) and high (≥15 weekly admission per 100 beds) COVID-19 admission rates, respectively. All distributions were calculated using hospital-level weights equal to the number of admissions in 2019. Florida is not shown due to data disclosure restrictions. Data were obtained from the Agency for Healthcare Research and Quality Healthcare Cost and Utilization Project State Inpatient Databases (2019-2020) for 45 US states.

