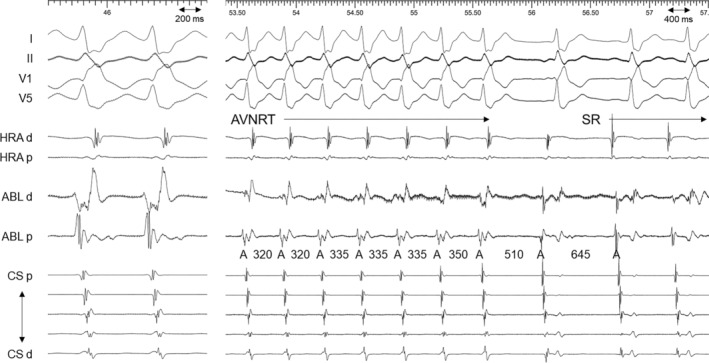
FIGURE 3.

Intracardiac electrograms from a cryoablation catheter just before (left panel) and during the cryothermal application (right panel). The cryothermal energy was delivered in the white‐colored area in the mid‐septal region. A, atrial; ABL, ablation catheter; AVNRT, atrioventricular reentrant tachycardia; CS, coronary sinus; d, distal; HRA, high right atrium; p, proximal; SR, sinus rhythm.
