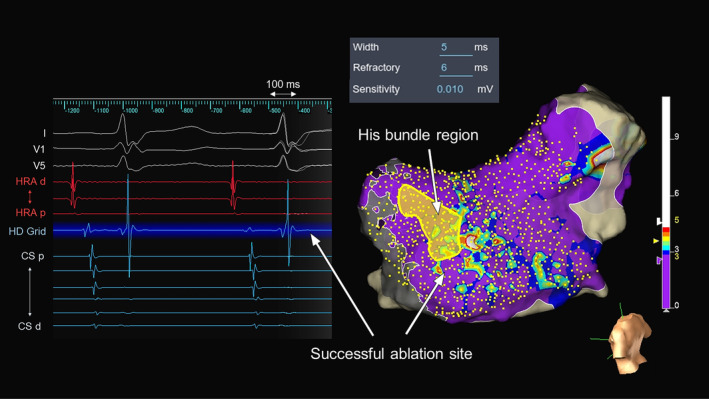
FIGURE 4.

Fractionation map created during sinus rhythm in the triangle of Koch and the local intracardiac electrograms at the successful ablation site. The color bar colors the higher fractionated potential area (fractionation threshold ≥5) as white and the lower fractionated potential area (fractionation threshold <3) as purple. Fractionation thresholds between 3 and 5 to 3 are colored blue, light blue, green, yellow, orange, and red. CS, coronary sinus; d, distal; HRA, high right atrium; p, proximal.
