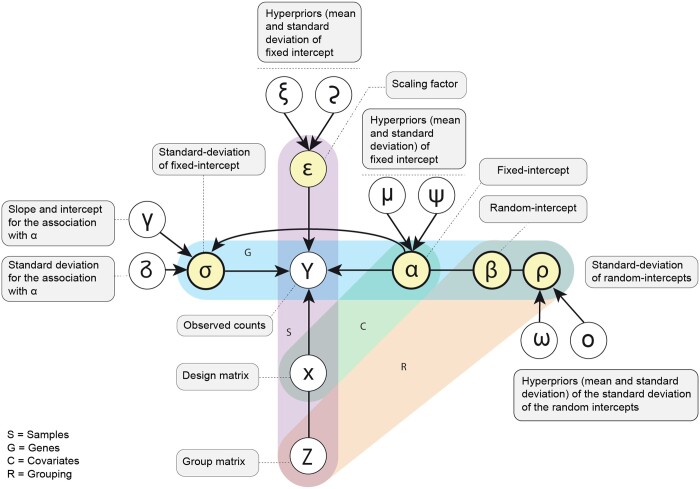
Figure 1.
Graphical plated representation of the inference model representing the Equations (1–15). The empty circles represent observed data or the constants of the hyperpriors given as data. The full circles represent parameters (reals, vectors, or matrices). The shaded frames represent the dimensionality of the variables. The squares include the description of the variables.

