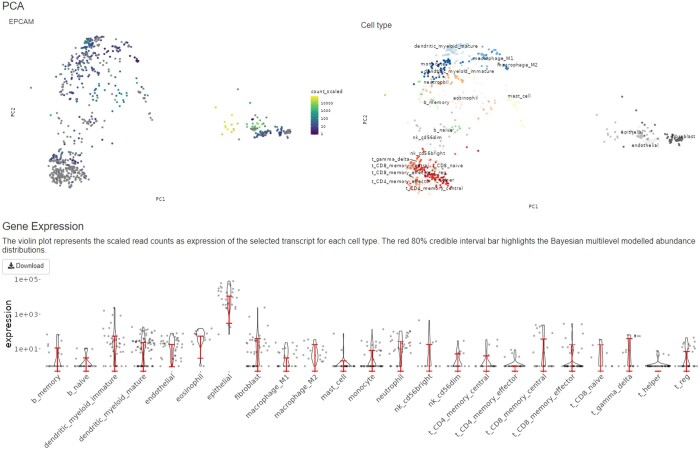
Figure 3.
The interactive web interface of HBCC. Raw and Bayesian-modelled transcript-abundance distribution of the EPCAM gene across 23 different cell types are presented here. Top-left PCA plot highlights the expression of this gene in different cell-type clusters where luminosity indicates expression levels, dots that are not colour-coded represent the samples which do not have any expression information for the query transcript.

