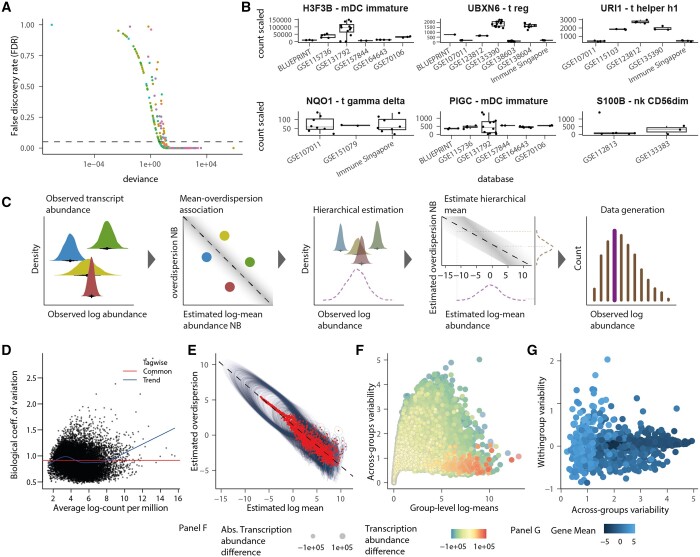
Figure 4.
Random intercept model multisource catalogue. (A) Significance of ANOVA test (on negative binomial generalized linear model) of each gene/cell type across datasets. Each dot is a gene/cell-type pair, coloured by cell type. The dashed line represents the significance threshold of 0.05 false-discovery rate. (B-top) A selection of three genes/cell-type pairs representing significant clustering according to the dataset. (B-bottom) A selection of three pairs in which transcript abundance is consistent across datasets. (C) Cartoon of the Bayesian random intercept model estimates gene/cell-type transcript abundance representing one gene-cell-type pair and four datasets. The four bright densities are the observed data distributions. The four bright dots are the point estimates. The dark distributions are the posterior densities for the estimates group –log mean transcript abundance. The purple dashed line is the posterior density for the group-level log-mean transcript abundance; the brown dashed density is the group-level standard deviation of transcript abundance. The thick line in the histogram represents the mean generated data distribution informed by the log-mean posterior density. In contrast, the thin lines represent the part of the generated data distribution informed by the overdispersion posterior density. (D) The edgeR trend of the tag-wise dispersion, on which estimation shrinkage is based. (E) The association between log-mean and log-overdispersion is linear compared to the association between log count per million and coefficient of variation modelled by edgeR (D). Red dots are point estimates, and the ellipse represents the uncertainty described by the posterior distribution (95% credible interval). (F) Marker genes (red-shaded points) have high transcription (x-axis) and low variability across datasets (y-axis, for the comparison of endothelial versus immune, fibroblasts, and epithelial). (G) The variability of gene-transcript abundance across datasets (x-axis) and within datasets (y-axis) are not associated (for endothelial cells).

