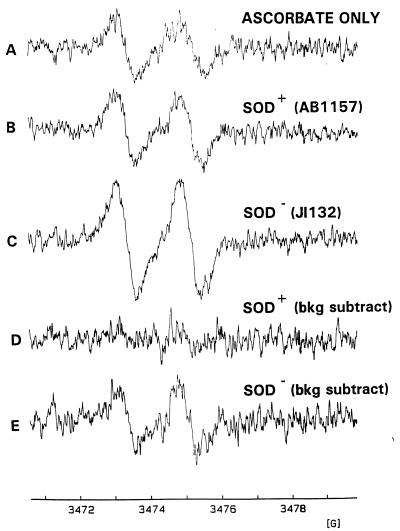
FIG. 4.
EPR visualization of ascorbate free radical. The EPR spectrum was obtained immediately after addition of ascorbate (200 μM) to a solution containing 200 μM EDTA and 5 mM NEM (A) in the presence of wild-type E. coli (2.5 × 10⁹/ml) (B) or in the presence of SOD-deficient E. coli (2.5 × 10⁹/ml) (C). (D and E) Results of subtraction of spectrum A from spectrum B and from spectrum C, respectively. bkg, background.

