
Figure 4.
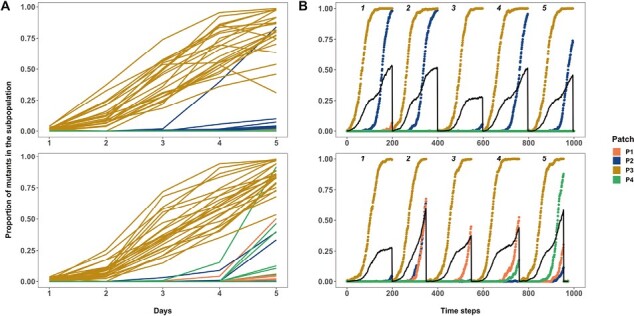
The proportion of the cipR mutants in the constituent subpopulations of each replicate metapopulation propagated as either star (both A and B, first row) or well-mixed (both A and B, second row) networks with unweighted migration of 0.001% (~100 individuals). (A) is the data from the experiment, and (B) is the data from the agent-based model. Subpopulation nomenclature: P3 = node of introduction of the cipR mutant, P2 = hub and P1 and P4 = rest of the peripheral leaves. In (A), cipR fixation dynamics in four subpopulations of each of the 24 replicate metapopulations under each network are shown (top = star, bottom = well-mixed). The black solid lines in (B) are the overall proportion of cipR mutants in a metapopulation. In (B), five replicate instantiations (each run for 200 generations) of the simulation are shown for each network (top = star, bottom = well-mixed).