
Figure 5.
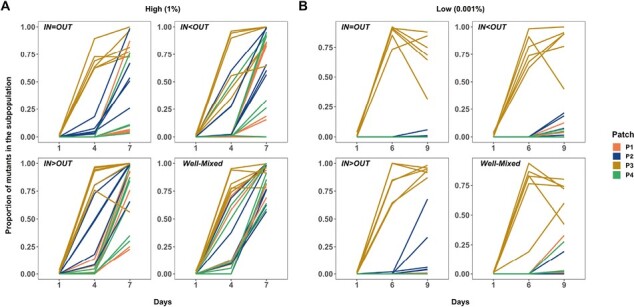
The proportion of the cipR mutants in the constituent subpopulations of each metapopulation propagated by either asymmetric star or well-mixed networks under high (A: 1% or 105 individuals) and low (B: 0.001% or 102 individuals) weighted migration. Subpopulation nomenclature: P3 = node of introduction of the cipR mutant, P2 = hub and P1 and P4 = rest of the peripheral leaves. In both (A) and (B), cipR fixation dynamics in four subpopulations of each of the six replicate metapopulations using each of the three asymmetric star networks and the well-mixed network are shown (see plot insets for details) under high and low migration rates, respectively.