
Figure 6.
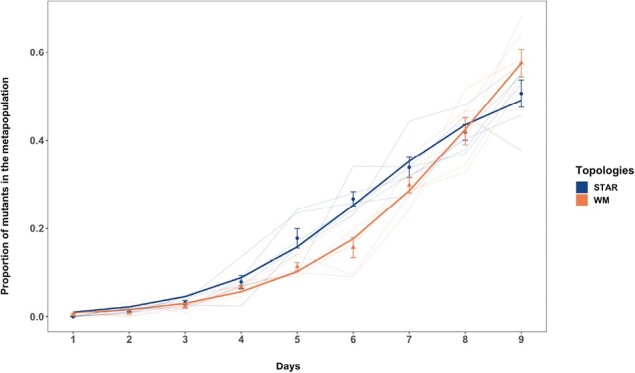
The proportion of cipR mutant in replicate metapopulations propagated on either an inward star (blue) or well-mixed (red) networks with low population size (105 CFU/ml) and low migration rate (103 CFU/ml). Bright lines are the nonlinear least squares (NLS) fit to the two network treatments. Each data point represents the mean proportion of all of the replicate metapopulations on that day, and error bars represent standard error (SE).