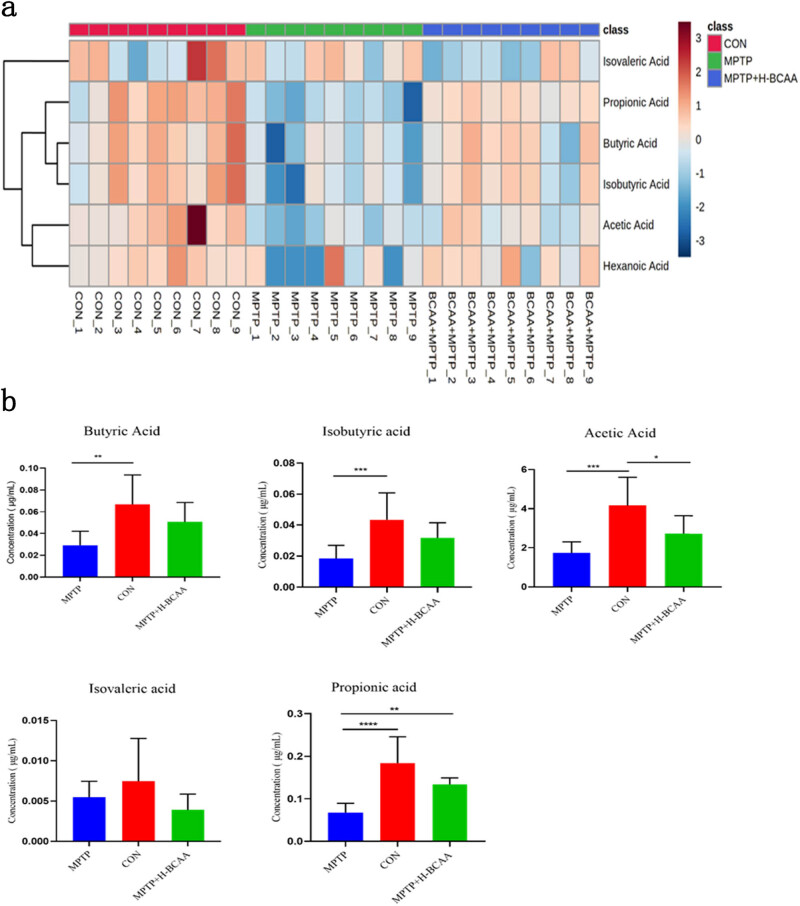
Figure 4.
(a) Relative levels of SCFA in each group of mice displayed in a heatmap. The degree of change is indicated by the color. (b) Box plots showing that the propionate level in the MPTP group was significantly lower than that in the MPTP + H-BCAA group. *, P < 0.05; **, P < 0.01; ***, P < 0.001.

