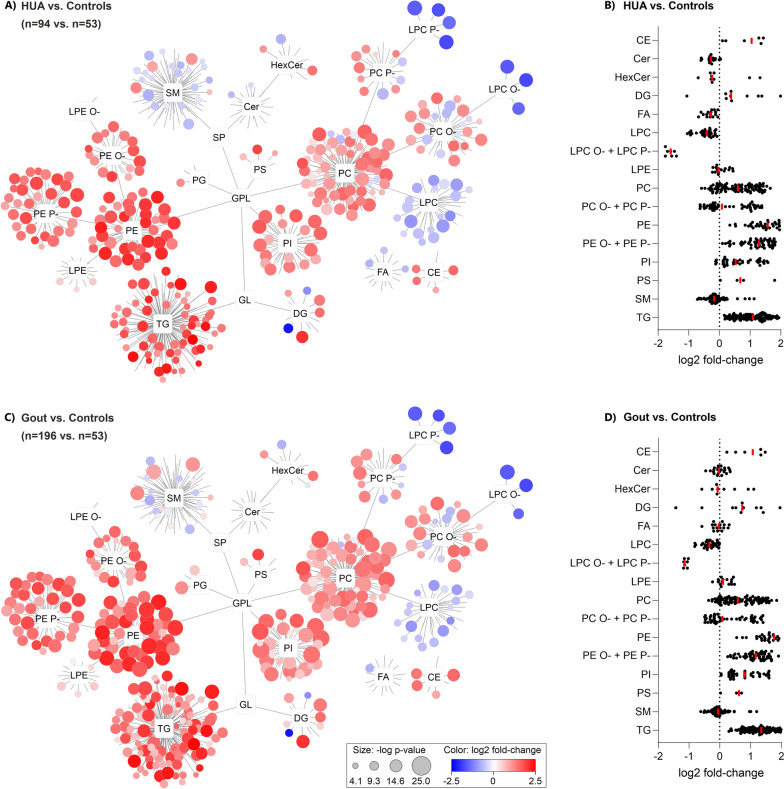
Fig. 2.
Plasma lipidome networks (A, C) and scatter plots (B, D) show similar systematic differences in the lipidome of HUA (A, B) and Gout (C, D) versus healthy controls. The most upregulated lipids were phosphatidylethanolamines (PE, median p-values were p = 2.1 × 10⁻¹⁴/p = 8.8 × 10⁻¹⁸ for HUA/Gout, respectively) and most downregulated were the lysophosphatidylcholine plasmalogens and plasmanyls (LPC P- and LPC O-, median p-values were p = 9.6 × 10⁻¹⁸/p = 3.8 × 10⁻¹⁷ for HUA/Gout, respectively). In the scatter plots (B, D), each dot represents the median value for one lipid in the corresponding class normalized by controls

