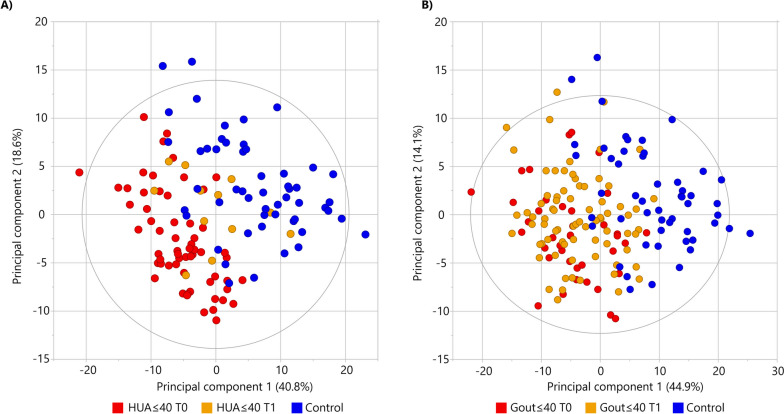
Fig. 5.
Multivariate statistics demonstrate the difference between patients and controls and the effect of urate-lowering treatment (ULT) based on the plasma lipidome. Principal component analysis of HUA ≤ 40 with ULT (T1, orange color) and without ULT (T0, red color) versus healthy controls (blue color) offers almost perfect separation (A) compared to Gout ≤ 40 with ULT (T1, orange color) and without ULT (T0, red color) versus healthy controls (B). Additionally, the HUA ≤ 40 group with ULT (T1) is shifted toward the healthy controls (A)

