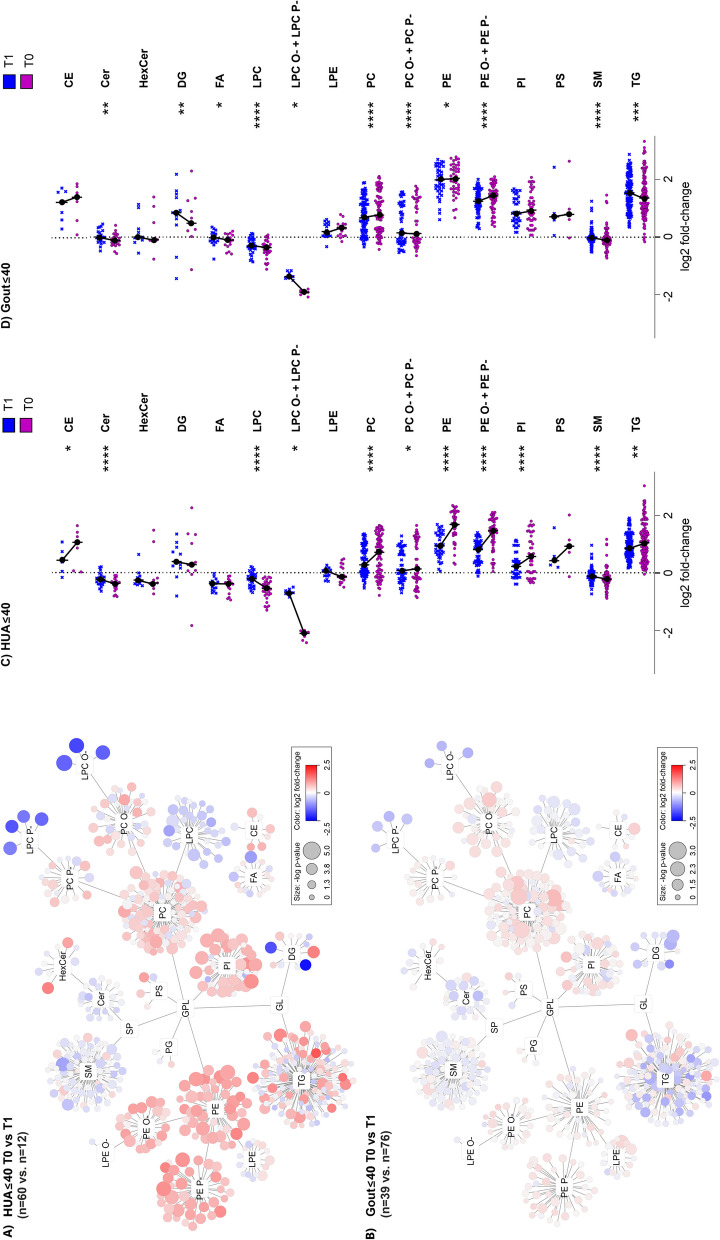
Fig. 6.
Urate-lowering treatment (ULT) shifts the lipidome profile of patients toward controls. On the plasma lipidome networks (A, B) and scatter plots (C, D), a different impact of the urate-lowering treatment on lipid profiles was observed when comparing HUA ≤ 40 and Gout ≤ 40 with or without ULT (T1/T0). Glycerophospholipids (PC, PE, PE O-, PE P-, PI, LPC O-,LPC P-) were significantly more normalized toward healthy controls in HUA ≤ 40 compared to Gout ≤ 40 (for example, in upregulated PE, the median fold-changes and original p-values (without Bonferroni correction) were 1.6/1.0 and 6.38 × 10⁻³/5.85 × 10−1 and for LPC O- and LPC P- they were 0.36/0.65 and 3.73 × 10⁻⁴/4.55 × 10−.2 for HUA ≤ 40 T0 vs. T1 and Gout ≤ 40 T0 vs. T1, respectively). In the scatter plots (C, D), each dot represents the median value for one lipid in the corresponding class normalized by healthy controls where the stars correspond to p-values (*/**/***/**** = p < 0.05/0.01/0.001/0.0001, respectively)

