Fig. 3.
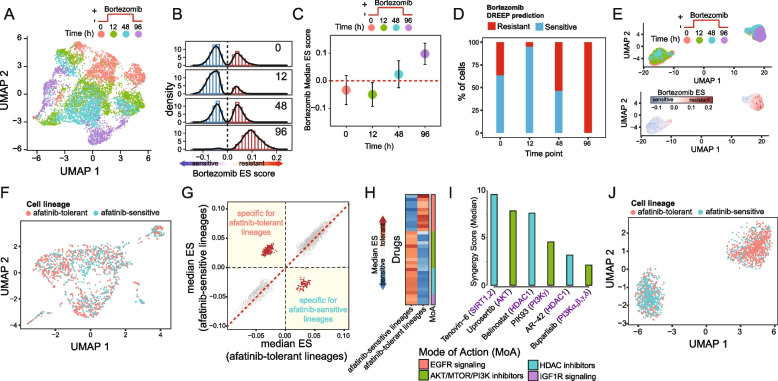
DREEP identifies drugs that can selectively inhibit a subpopulation of cells. A UMAP plot of 7440 cells of the MCF7 cell line exposed to 500 nM bortezomib. B Bortezomib DREEP enrichment score (ES) distribution at each timepoint for the 7440 cells of the MCF7 cell line in A. A positive or negative score means that the cell is predicted to be resistant or sensitive to bortezomib, respectively. C Bortezomib DREEP’s median enrichment score of MCF7 cells at each time-point. D Percentage of predicted bortezomib sensitive or tolerant cells for each time point. E UMAP plot of the same cells in A but using the drug profile estimated by DREEP instead of its corresponding transcriptional profile for each cell. In the left panel, cells are colour-coded according to the sequencing timepoint, while in the right panel cells are colour-coded according to the bortezomib score predicted by DREEP. A positive or negative score means that the cell is predicted to be resistant or sensitive to bortezomib, respectively. F UMAP plot of 1541 MDA-MB-468 cells from Pellecchia et al. [4]. Cells are colour-coded according to whether they belong to an afatinib-sensitive or tolerant lineage. G Each point represents a drug whose coordinates are the median enrichment score predicted by DREEP for the drug in afatinib-tolerant cells [x-axis] and afatinib-sensitive cells [y-axis]. The more negative the value of the enrichment score, the more potent the predicted effect of the drug. The drugs specifically inhibiting at least one of the two subpopulations are indicated in red. H Heatmap showing enriched drug classes predicted to specifically inhibit afatinib-tolerant or afatinib-sensitive cells. Each row of the heatmap represents a drug coloured according to its median enrichment score predicted by DREEP across cells of the same lineage (i.e. afatinib-tolerant or afatinib-sensitive). I Median synergy score of drugs predicted by DREEP to selectively inhibit afatinib-tolerant lineages in MDA-MB-468 cells. Each drug was tested in combination with afatinib, and the synergy score computed using the Loewe statistical model. A positive score represents a synergism between the two tested drugs. J UMAP plot of the cells in A but using the drug profile estimated by DREEP instead of the corresponding transcriptional profile for each cell. Cells are colour-coded according to whether they belong to an afatinib-sensitive or tolerant lineage

