
FIGURE 3.
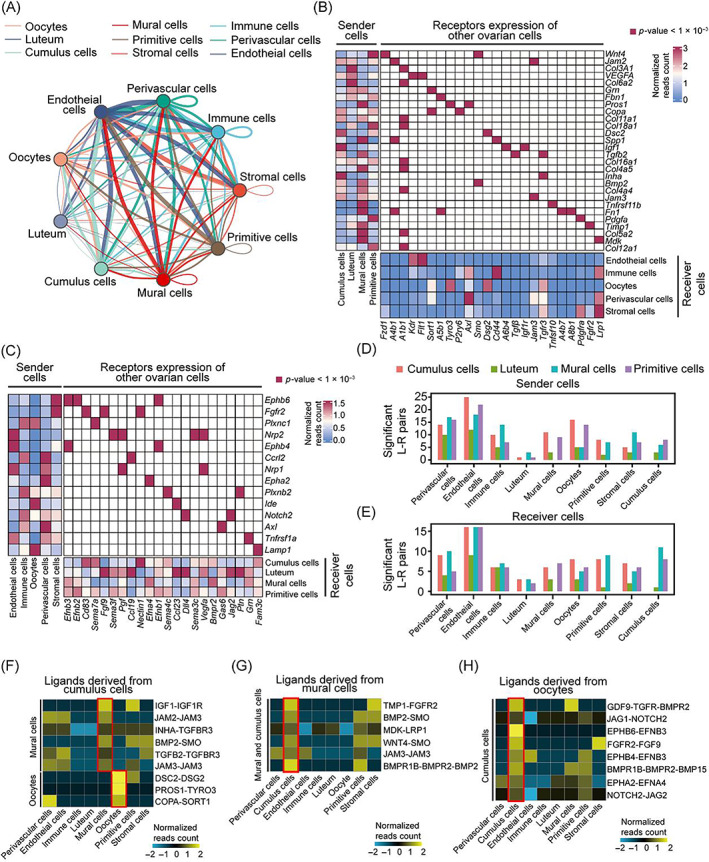
Interaction between granulosa cells and other somatic ovarian cells during follicular development. (A) The cellular communication network of four granulosa subtypes with ovarian cells. (B) Heatmap showing the average expression of cellphoneDB predicted ligands expressed by granulosa cells (GCs; left), ligand‐matched receptors expressed by ovarian cells (bottom), and the significantly enriched ligand‐receptor pairs between granulosa sub‐populations and ovarian cell type pair (middle) from scRNA‐seq data. (C) Heatmap showing the expression of cellphoneDB predicted ligands expressed by ovarian cells (left), ligand‐matched receptors expressed by GCs (bottom), and the significantly enriched ligand‐receptor pairs between ovarian cell types and granulosa sub‐population pair (middle) from scRNA‐seq data. (D,E) Bar plots of significantly enriched ligand–receptor (L–R) pairs (p < 0.001). Ligands were expressed in GCs subtypes and receptors were expressed across immune cells, perivascular cells, and endothelial cells (D). Receptors were expressed in GCs subtypes and ligands were expressed across immune cells, perivascular cells, and endothelial cells (E). (F–H) Heatmap showing the average expression of L–R pairs for which ligands derive from cumulus and receptors are expressed in oocyte and mural GC (F), ligands derive from mural and receptors are expressed in cumulus GC (G), and ligands derive from the oocyte and receptors are expressed in cumulus GC (H).