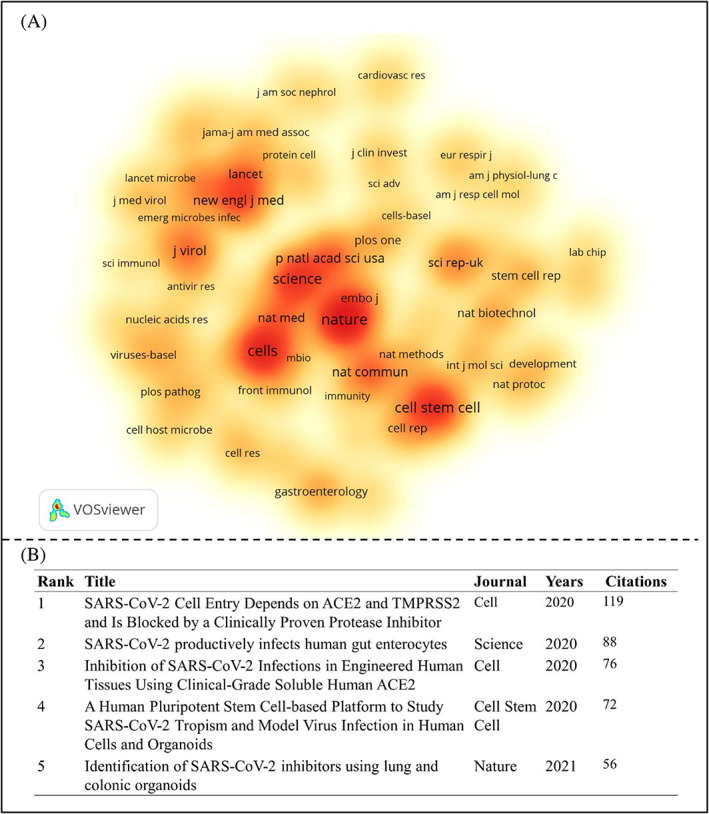
FIGURE 2.

Co‐citation analysis of the publications regarding organoid application for COVID‐19 study. (A) The density visualized network of the contributing journals (more than 50 citations). The intensity of hotspots indicates the frequency of occurrences of that item. Warm colours represent hot terms and cool colours represent cool items. (B) The top 5 co‐cited references for organoid‐based COVID‐19 research.
