FIGURE 3.

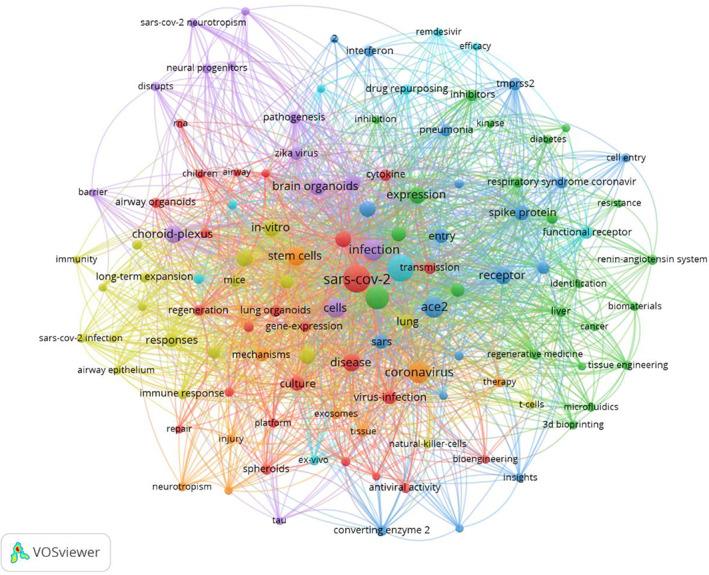
Keyword co‐occurrence (at least three times) network visualization of the research of organoids for SARS‐CoV‐2 infection. Node size indicates the occurrence frequency; node colour represents the cluster; cluster resolution = 1.00.

Keyword co‐occurrence (at least three times) network visualization of the research of organoids for SARS‐CoV‐2 infection. Node size indicates the occurrence frequency; node colour represents the cluster; cluster resolution = 1.00.