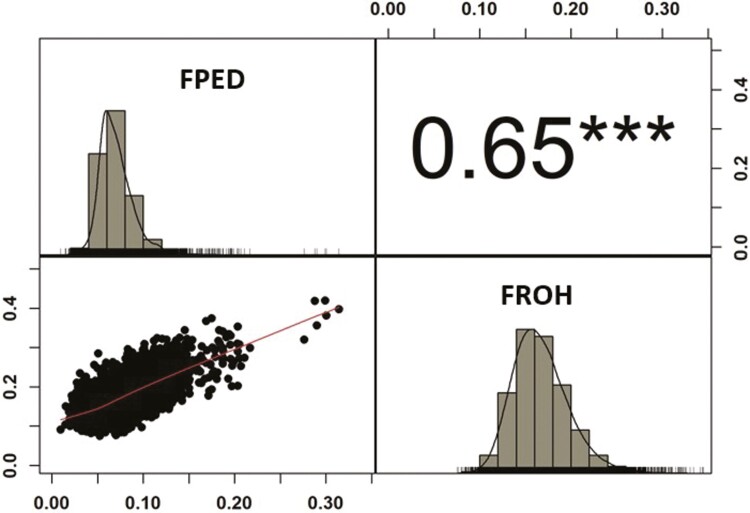
Figure 1.
Pearson product-moment correlation (above diagonal) with the level of significance of the correlation (P-value ***≤0.001), and x-y plot (below diagonal) between FPED (pedigree-based) and FROH (runs of homozygosity-based) inbreeding coefficients. On diagonal the distributions of FPED and FROH inbreeding coefficients.

