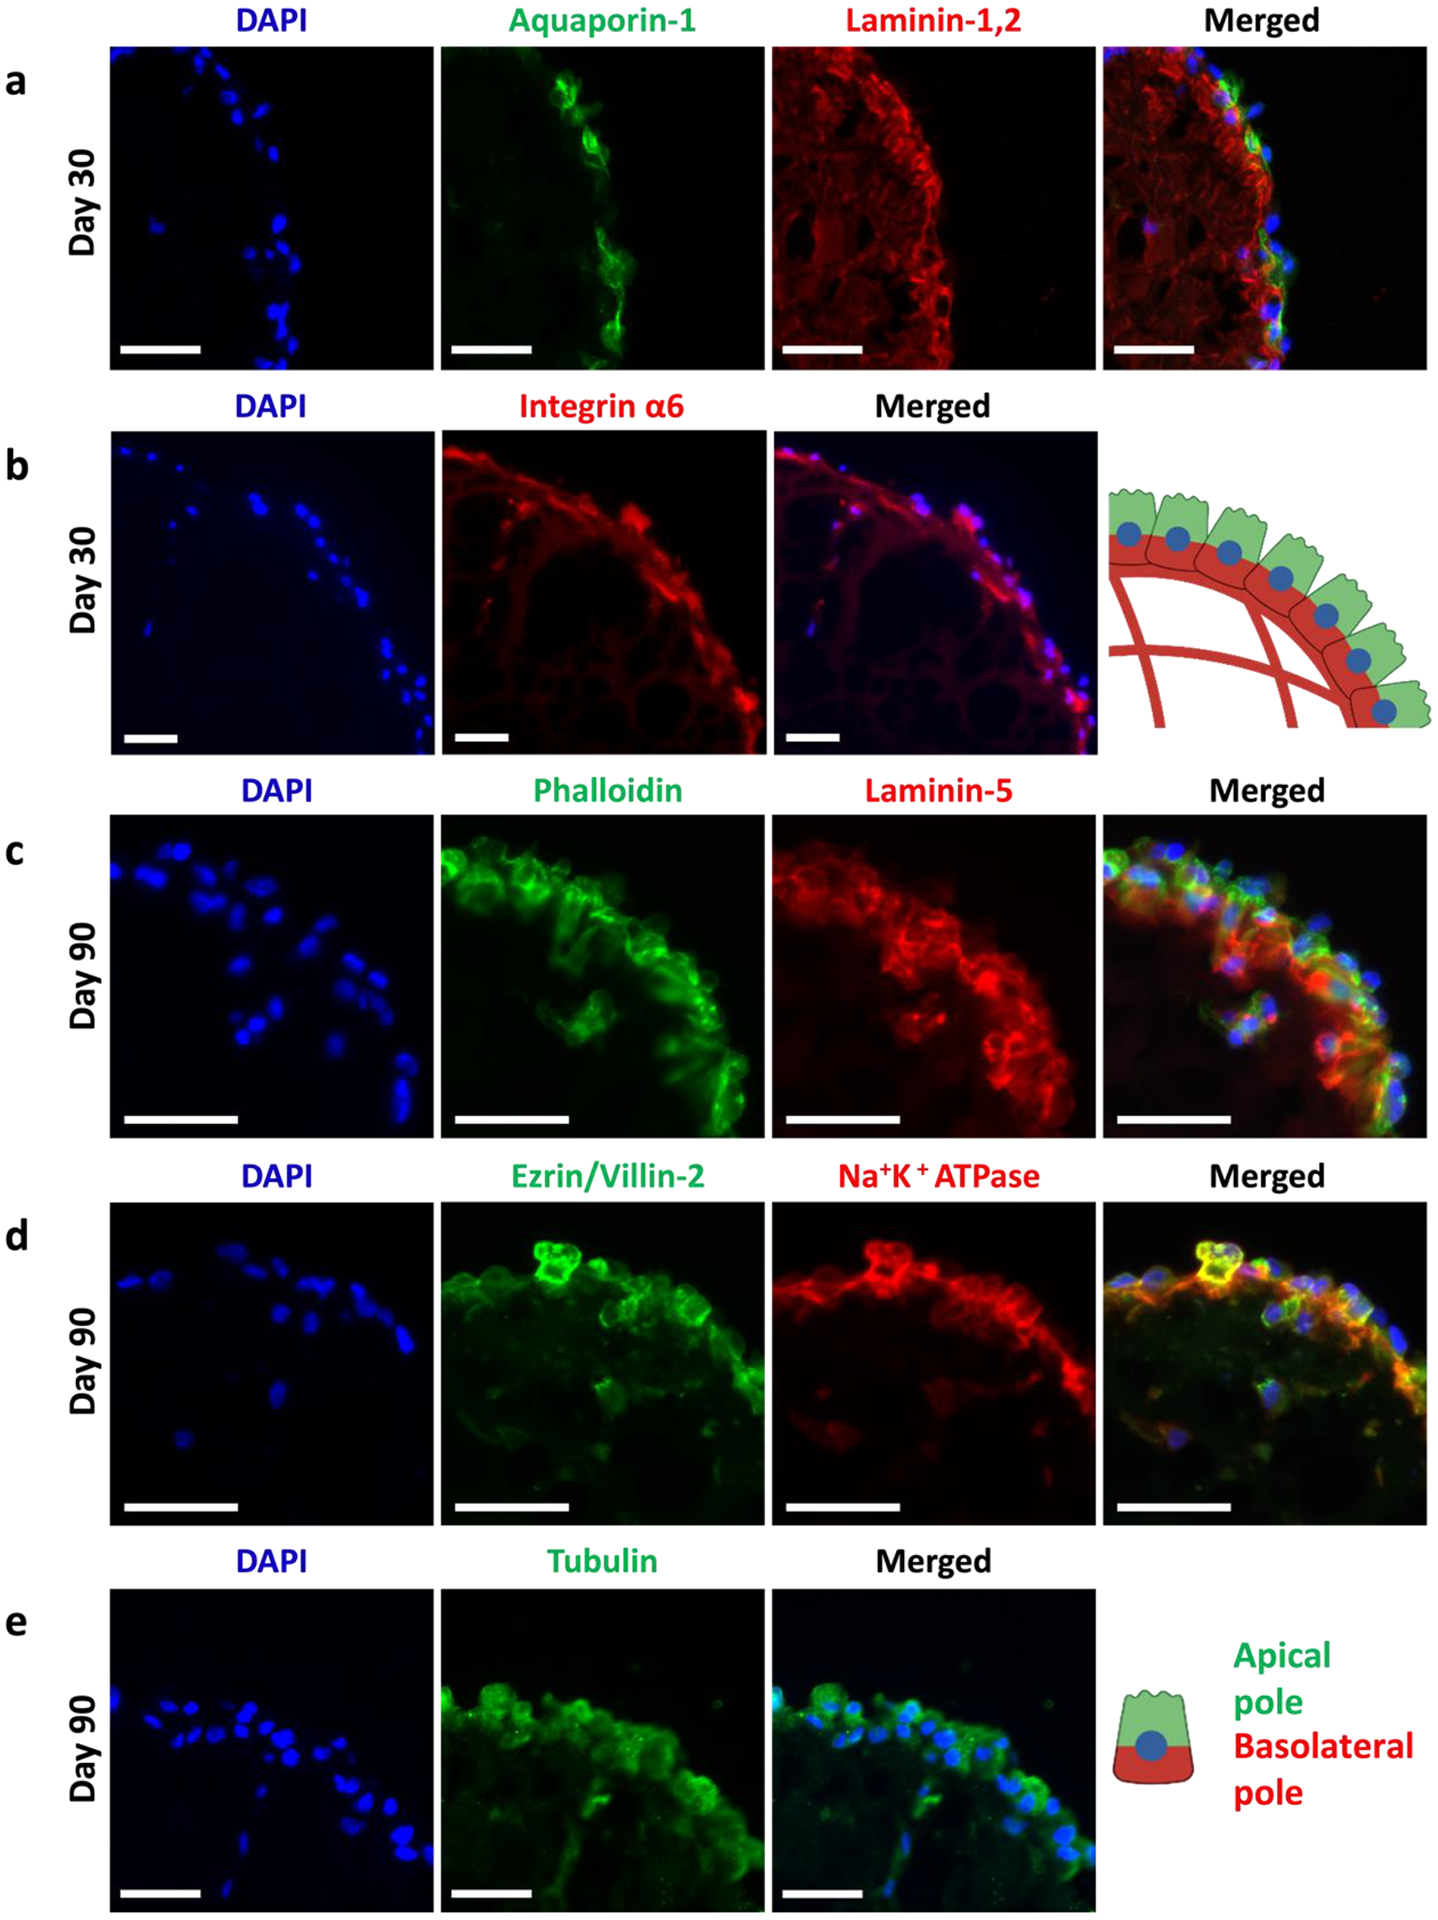
Figure 3. RPTEC organoids exhibit basal-in and apical-out phenotype.

(a) Immunofluorescence staining images of: (a) DAPI (blue), aquaporin-1 (green), laminin-1,2 (red), and merged; (c) DAPI (blue), phalloidin (green), laminin-5 (red), and merged; (d) DAPI (blue), ezrin/villin-2 (green), and Na+K+ATPase (red), and merged; (e) DAPI (blue), tubulin (green), and merged. Schematic shows basal-in (red) and apical-out (green) phenotype. All scalebars represent 50 μm.
