
Figure 4. RPTEC organoid transcriptomics.
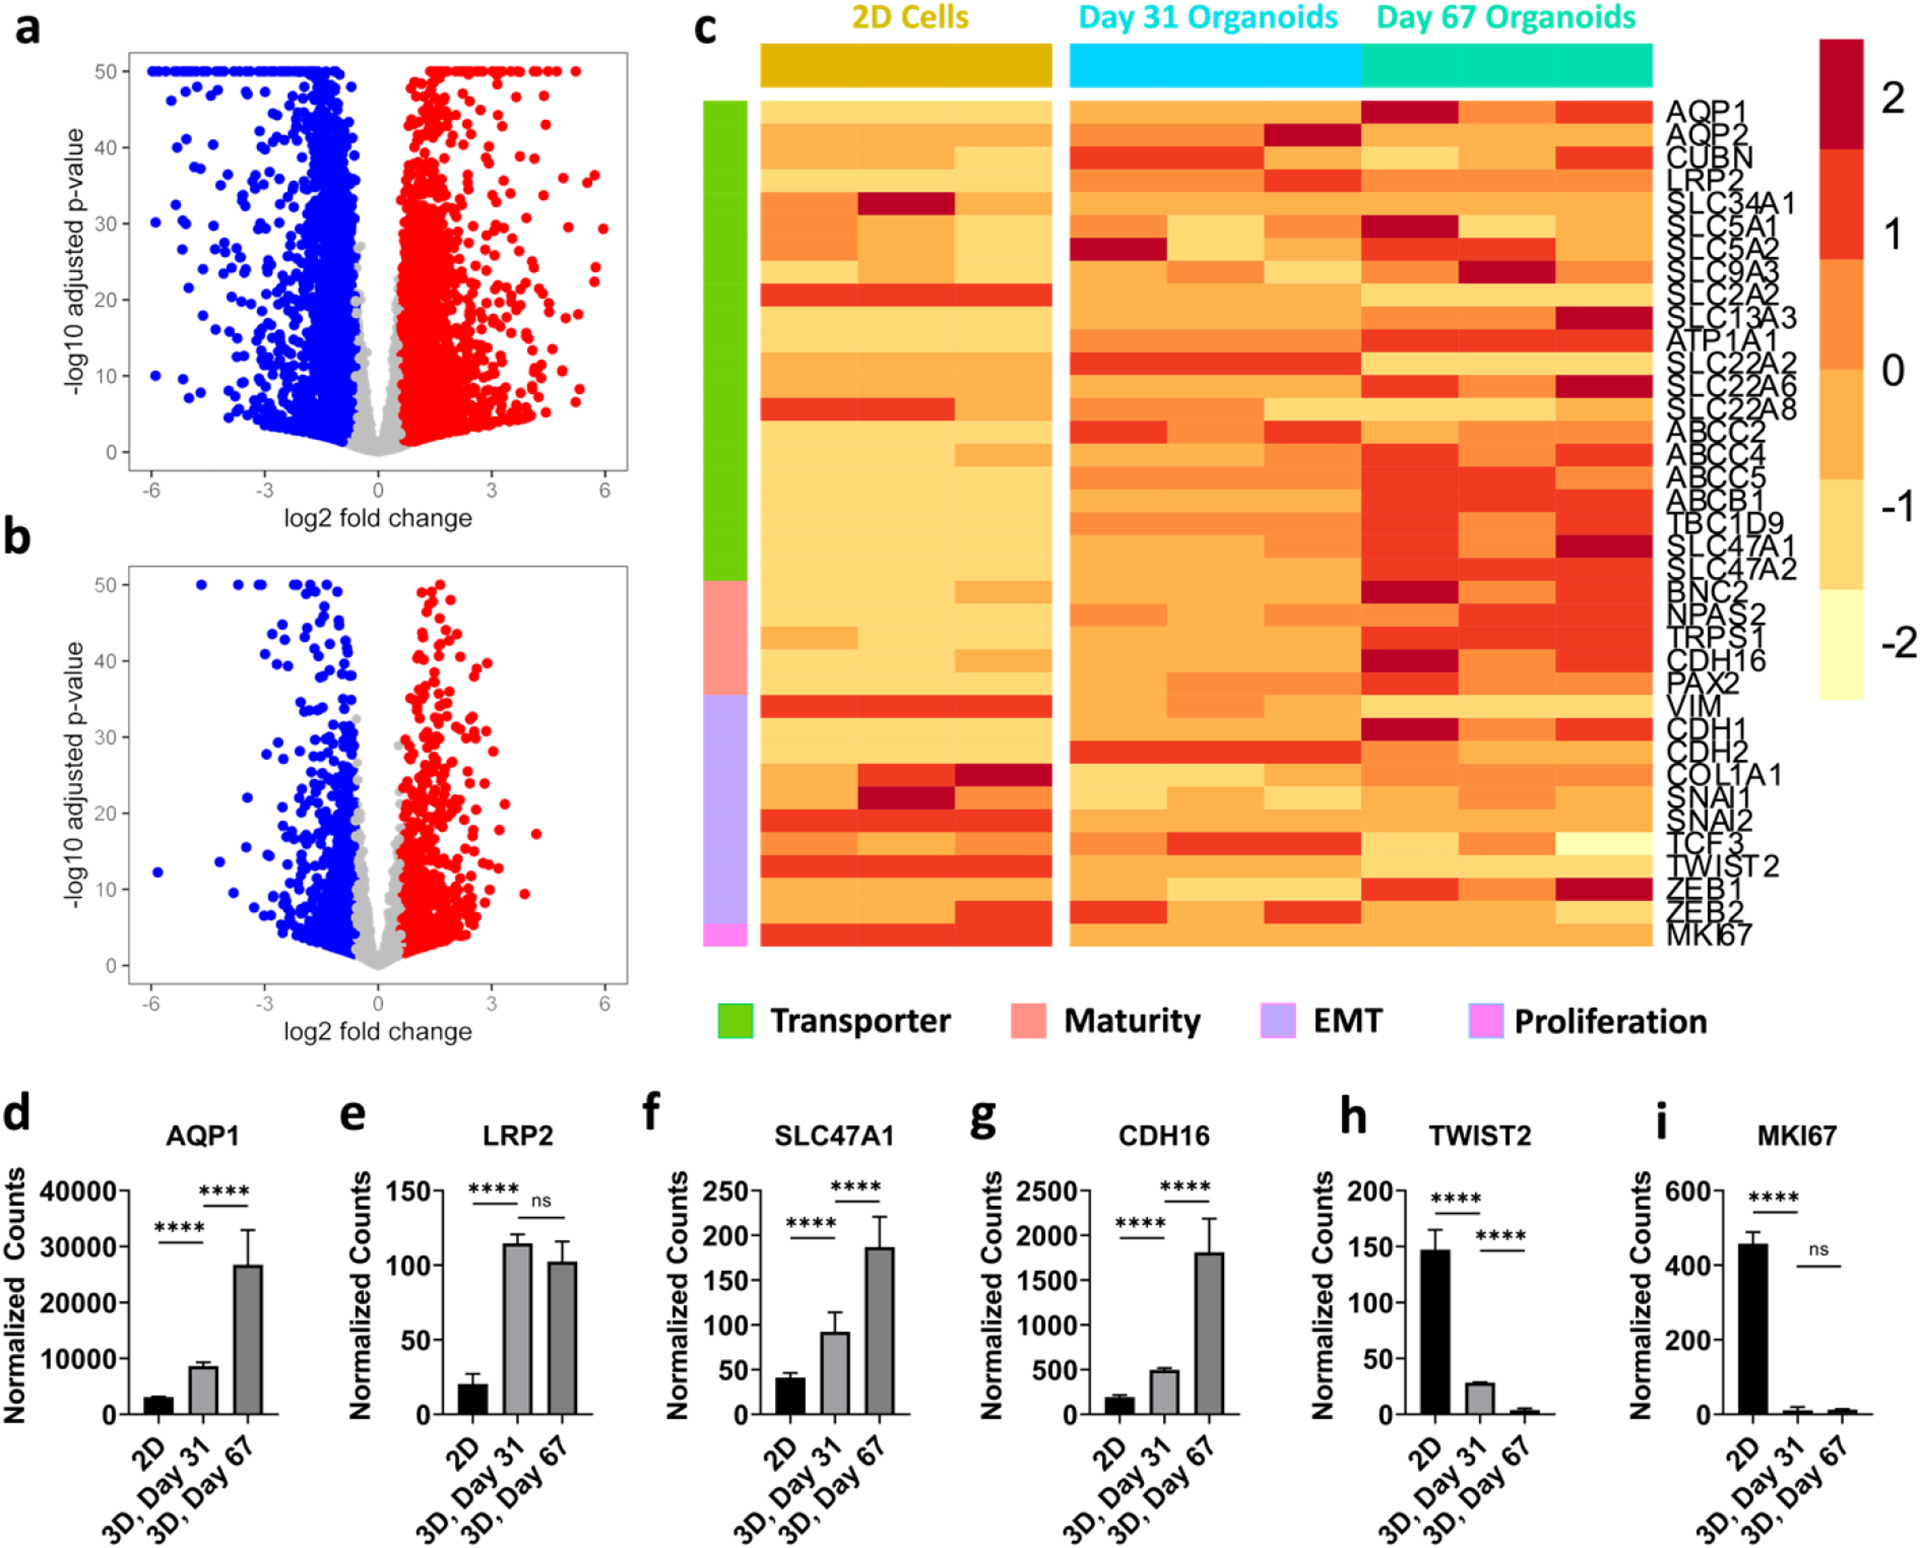
(a) Volcano plot from bulk RNAseq comparing day 31 organoids with 2D RPTECs, and (b) day 67 with day 31 organoids. (c) Heatmap from bulk RNAseq comparing day 67 organoids, day 31 organoids, and 2D RPTECs. The colors in the heatmaps represent Z-scores computed from normalized gene counts. Normalized counts of genes of day 67 organoids, day 31 organoids, and 2D RPTECs for (d) AQP1, (e) LRP2, (f) SLC47A1, (g) CDH16, (h) TWIST2, and (i) MKI67. n = 3 for both 2D and organoid samples. These genes were significantly different based on the LRT with the Benjamini-Hochberg correction. **** denotes p ≤ 0.0001.