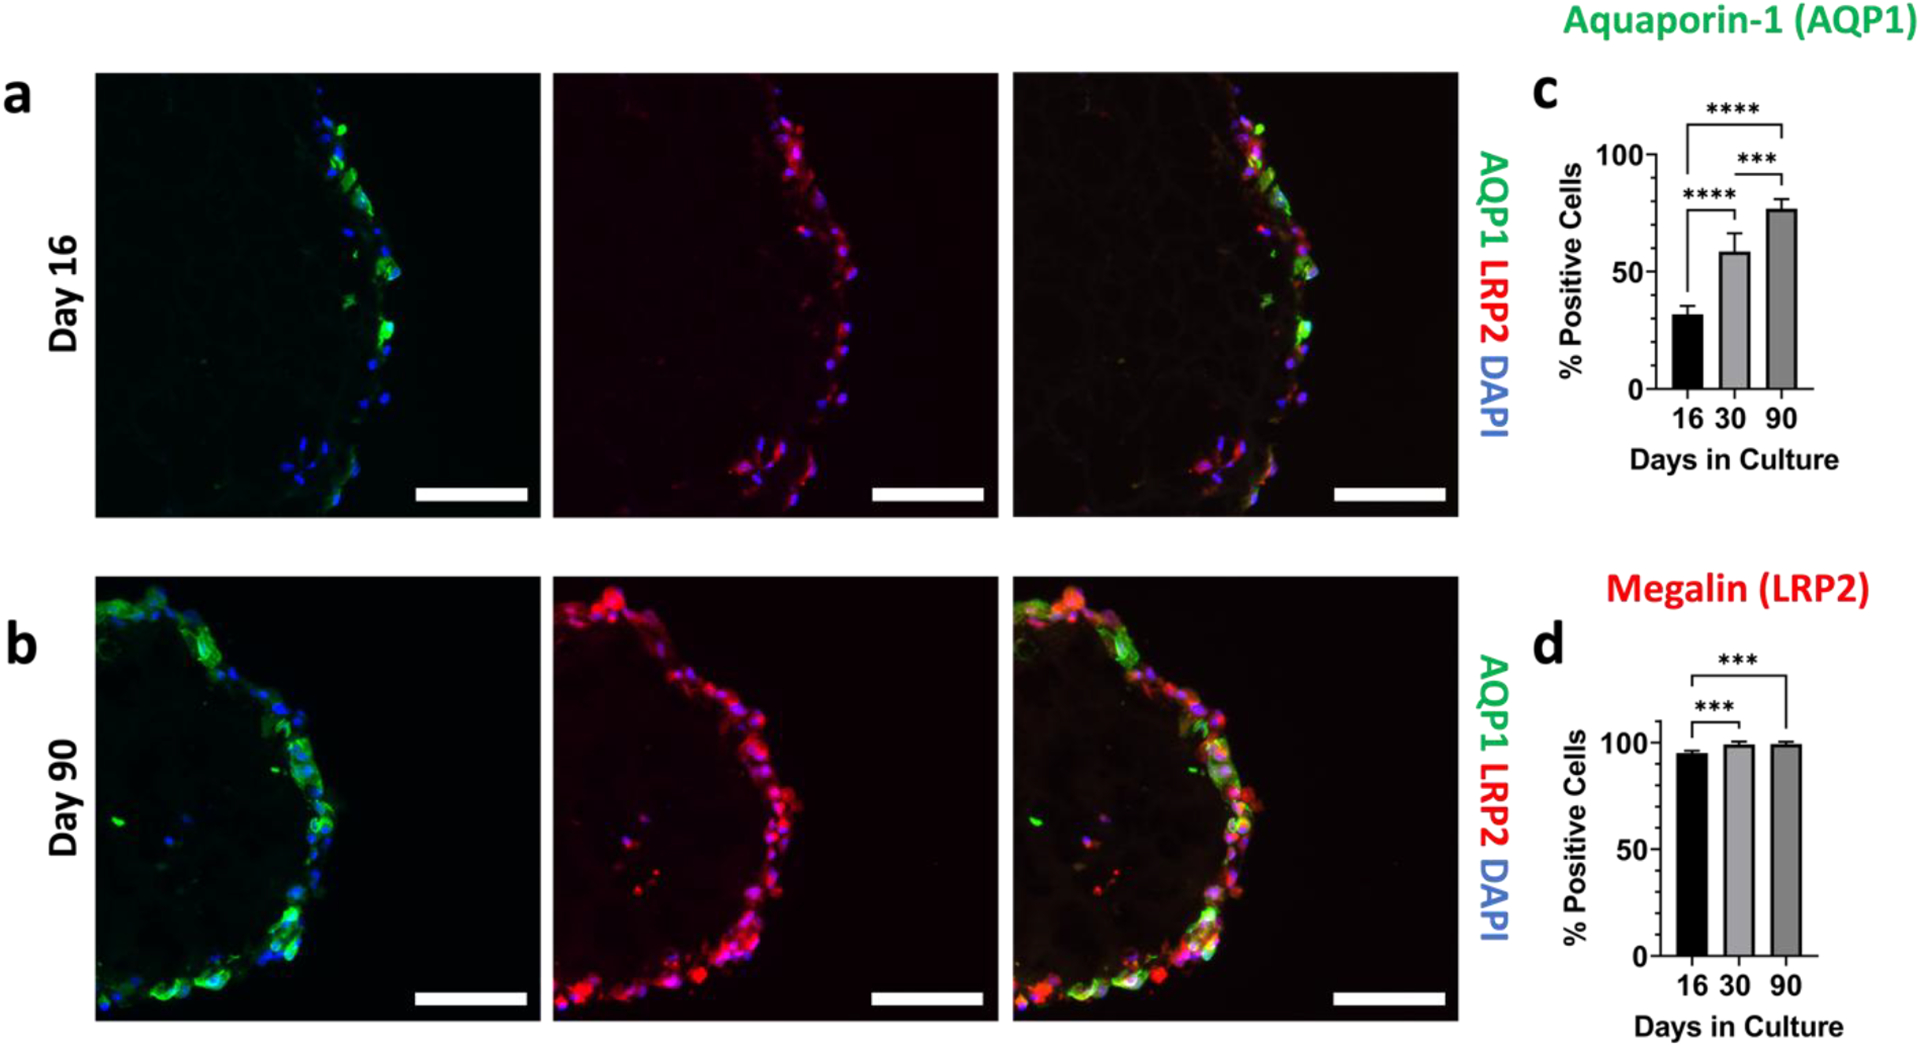
Figure 5. Organoids show maturity over 90 day growth period.

Immunofluorescence images of aquaporin-1 (green), megalin (red), DAPI (blue), and the channels merged at (a) day 16, and (b) day 90 of their culture. All scalebars represent 100 μm. (c) Quantification of the percentage of cells that were positive for aquaporin-1. (d) Quantification of the percentage of cells that were positive for megalin. For panels (c) and (d), n=5 per timepoint. One-way ANOVA was performed using Tukey’s multiple comparisons. *** denotes p ≤ 0.001 and **** denotes p ≤ 0.0001.
