
Figure 6. RPTEC organoids uptake albumin, and show dose- and time-dependent KIM-1 production to HSA stimulus.
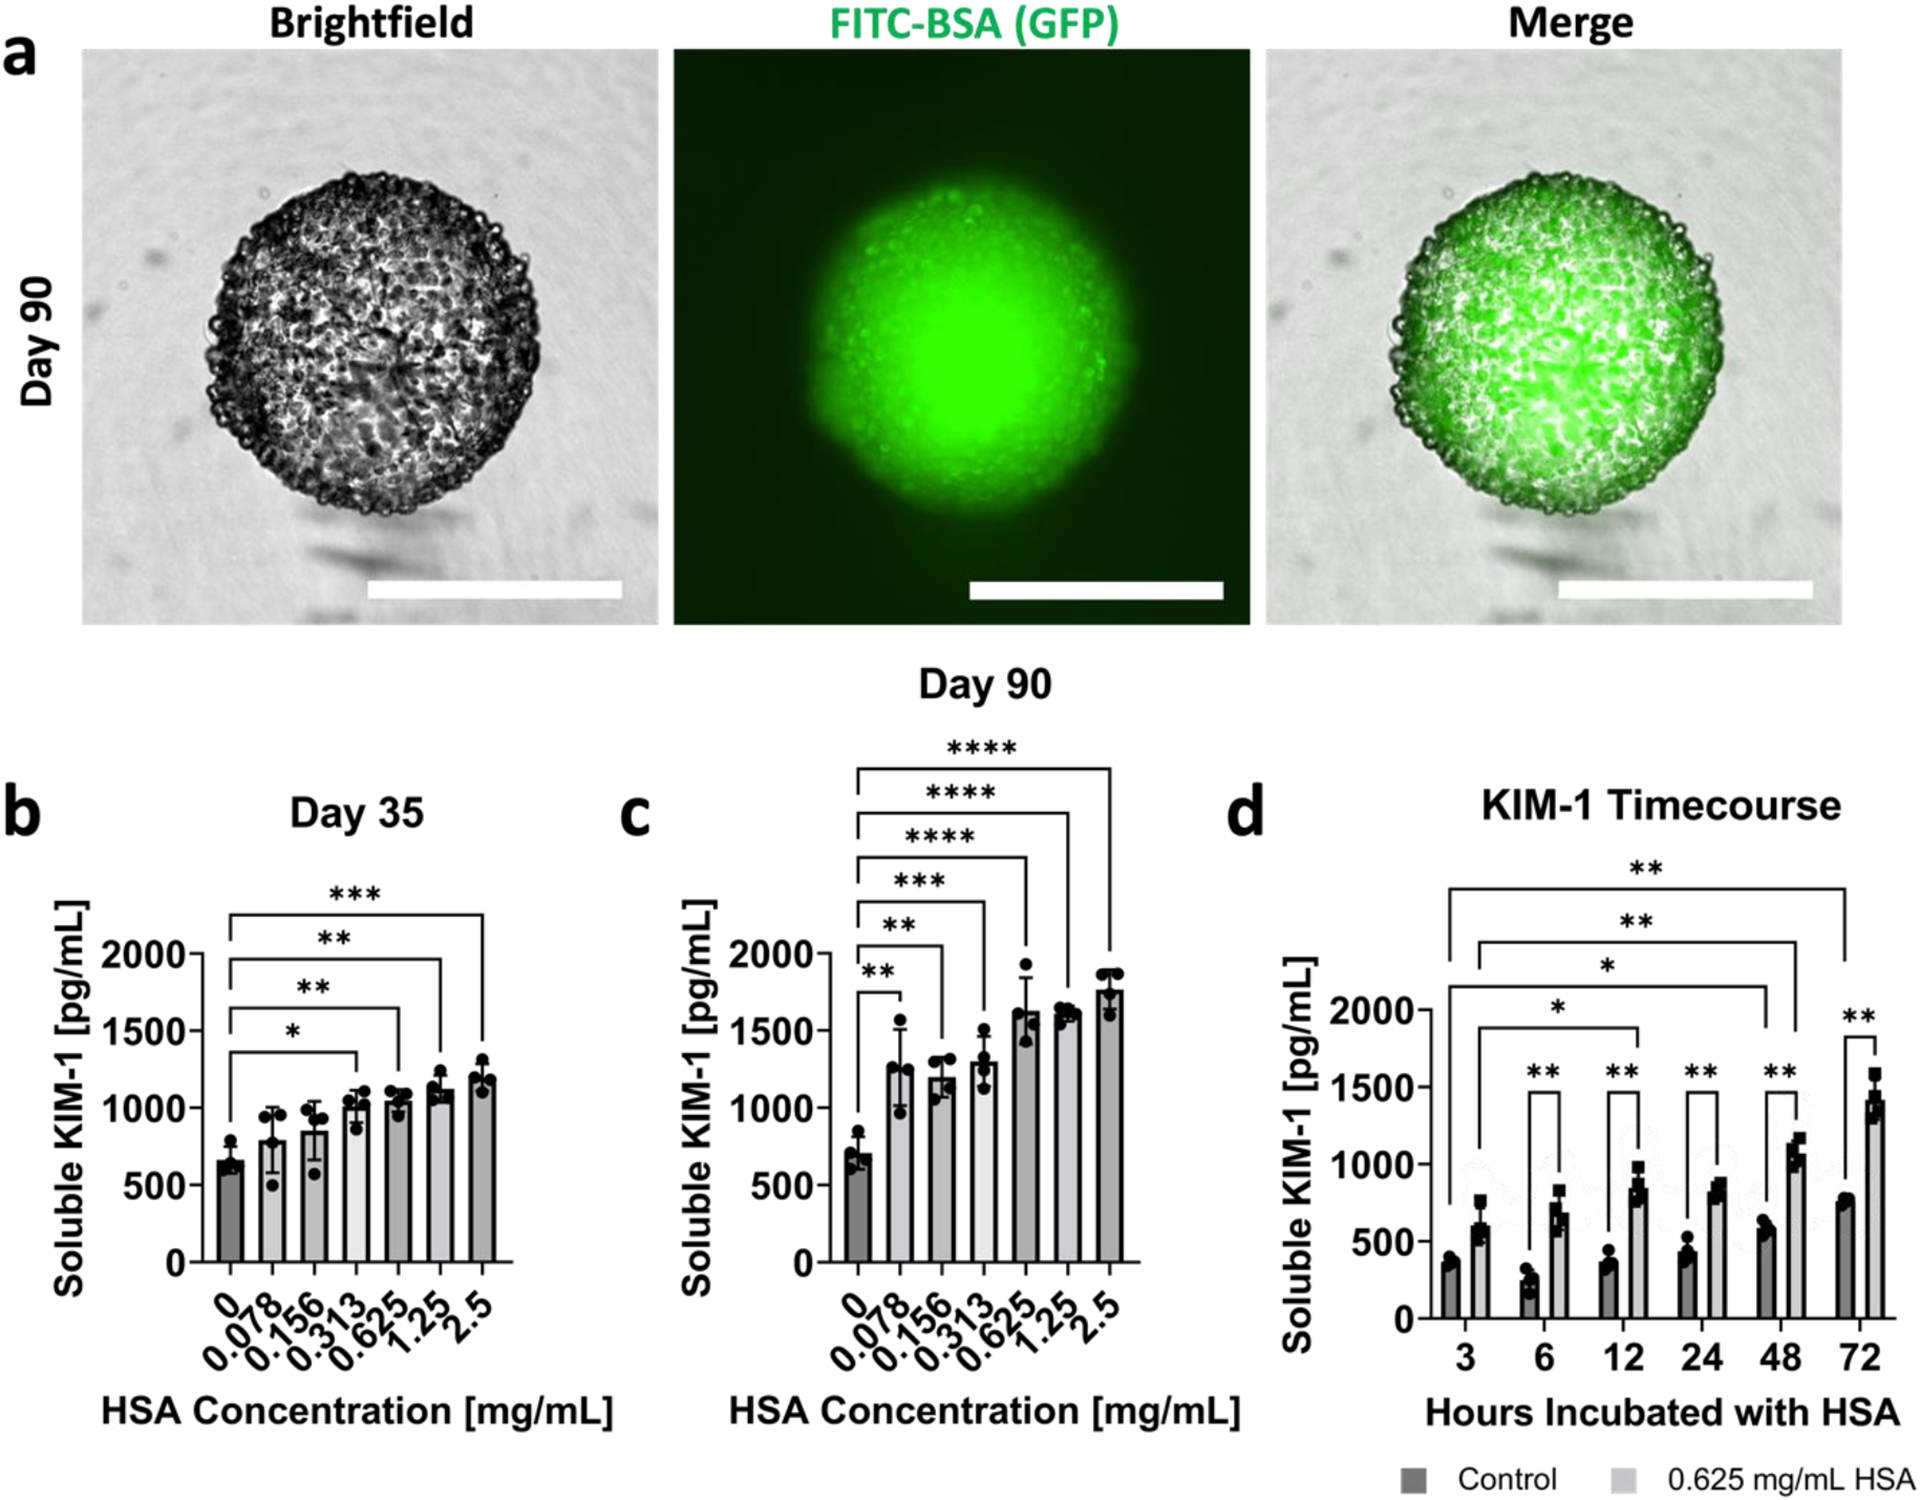
(a) Brightfield, GFP, and merged images of FITC-BSA uptake in day 90 RPTEC organoids. All scalebars represent 500 μm. Dose dependent KIM-1 production for organoids exposed to HSA at (b) day 35 and (c) day 90 of their culture. (d) Time-dependent KIM-1 production for control organoids and organoids exposed to 0.625 mg/mL HSA. For all plots, n = 4 was used for each dose or time point. One-way ANOVA with Tukey’s multiple comparisons was used for panels (b) and (c). Two-way ANOVA with Šīdák’s multiple comparison tests was utilized for panel (d). For all statistical tests, * indicates p ≤ 0.05, ** indicates p ≤ 0.01, *** indicates p ≤ 0.001, and **** indicates p ≤ 0.0001.